Market Snapshot
| Indices | Week | YTD |
|---|
To the casual observer, it might seem that Markets had a “ho-hum” first quarter, with the Blue Chip barometer S&P 500 up 1.4%. Annualize that and you get a roughly 6% return — below the historic 10% overall return for stocks but respectable in essentially a zero percent interest rate environment.
What that lucky person would have missed was the heavy dose of volatility Market participants received — a frightening drop of 9% from January 1st to February 11th, followed by a 10% rise through the end of March.
While the net result was a roller coaster ride that ended up at the same spot it started, investors in stocks got to experience the air going out of their stomachs and the thrill of climbing up the rails, expecting a drop at any second.
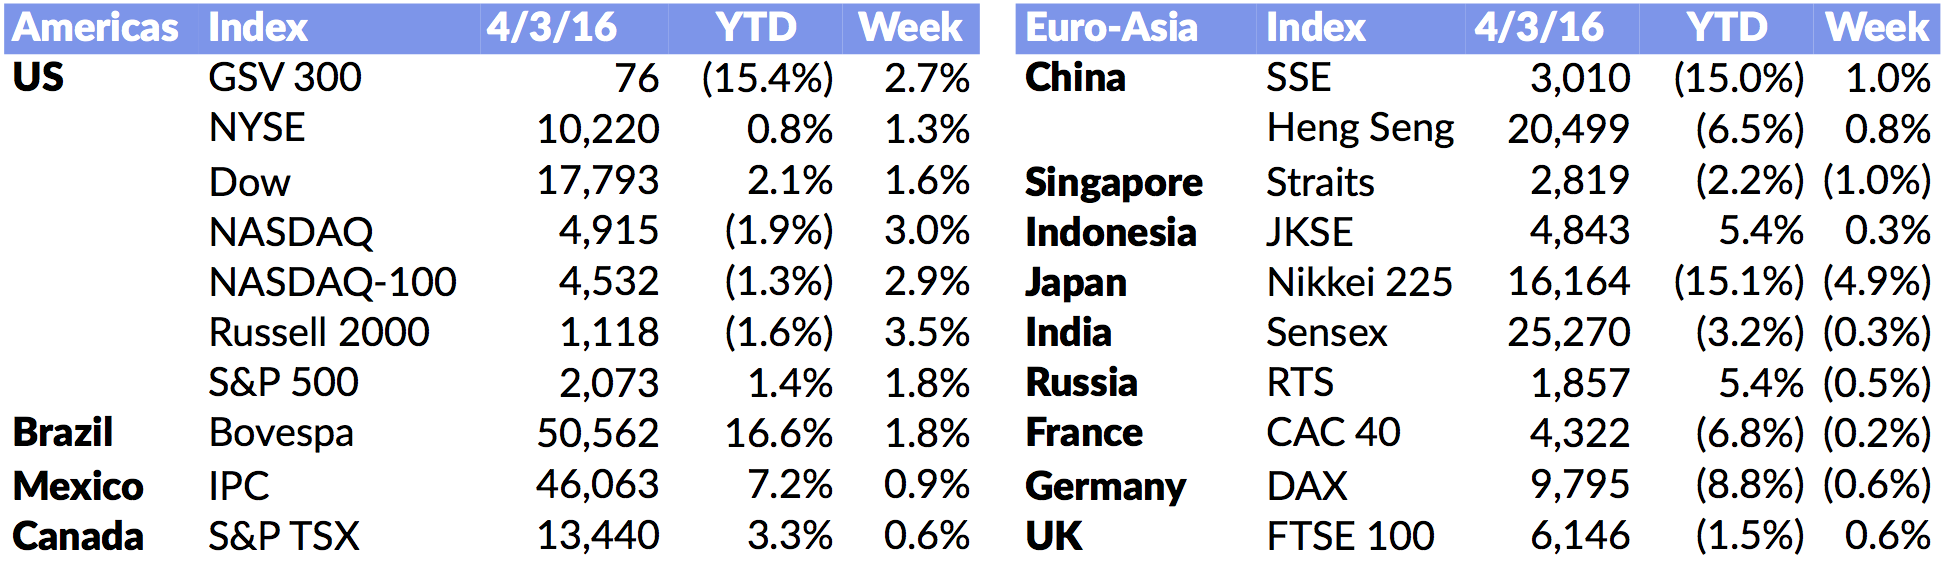
Moreover, while the market cap weighted S&P 500 is the best proxy for what’s going on with large, traditional, U.S.-based businesses, it wasn’t too reflective of the broader global constellation of listed companies. For example, China’s main index was off 16.5% for the quarter, India was down 4.5%, Germany’s DAX declined 7.4%, and Japan’s Nikkei 225 was down 12.1%.
In growth land, NASDAQ finished the first quarter off 3%. Our own GSV 300 — made up of the 300 fastest growing companies in the World — was down a whopping 15% for the quarter.
It makes sense that in an environment where people are scared about everything from ISIS to the Presidential Election, “safe” stocks such as Kraft Heinz sell at a P/E of 21.1x despite negative growth. “Conventional Wisdom” knows that whatever goes on, people still need to eat. And Warren Buffett is the best investor of all time, so it can’t be bad to saddle up with him during this bumpy ride.
Forget the fact that people aren’t eating the unhealthy junk Kraft Heinz is making and are increasingly going to Whole Foods and Trader Joe’s — ketchup is where you go when you are afraid of what’s next. When investors believe there might not be a future, they don’t invest in “futures”, which is what growth stocks are.

One might naturally expect us to be upset that GSV 300 had such brutal performance, but actually, we are pleased that we have created a scorecard that reflects what is actually going on in the World of growth stocks. Constituents are selected through a systematic process described below — they’re not handpicked — and the result doesn’t look at all like the indexes that people typically use to analyze growth companies and growth investors.
The most relevant index for Institutional Investors is the S&P 500, which is a good proxy for broad Market dynamics. But with a 5% long term growth rate, it hardly reflects conditions or performance for fast growing companies.
The fact that the S&P 500 is solely a market cap weighted index is problematic in that a $100 Billion Market Cap Company has 100x the impact on the Index as a $1 Billion Market Cap Company… not realistic in that a portfolio manager who viewed two portfolio companies as being equally attractive would have 100x more of that company in their portfolio.
The most well-known index, the Dow Jones Industrial Average (DJIA), is created with an even more bizarre rationale in that it is weighted by share price. So in other words, if one stock was $30 per share and another was $300 per share, the $300 stock would have 10X the influence on the DJIA as the $30 stock.
Given GSV’s passion, obsession and vocation of growth stock investing, and the dearth of focused, tailored information and insight, we’ve decided to adopt the wise saying, “If you want something done right, do it yourself.”
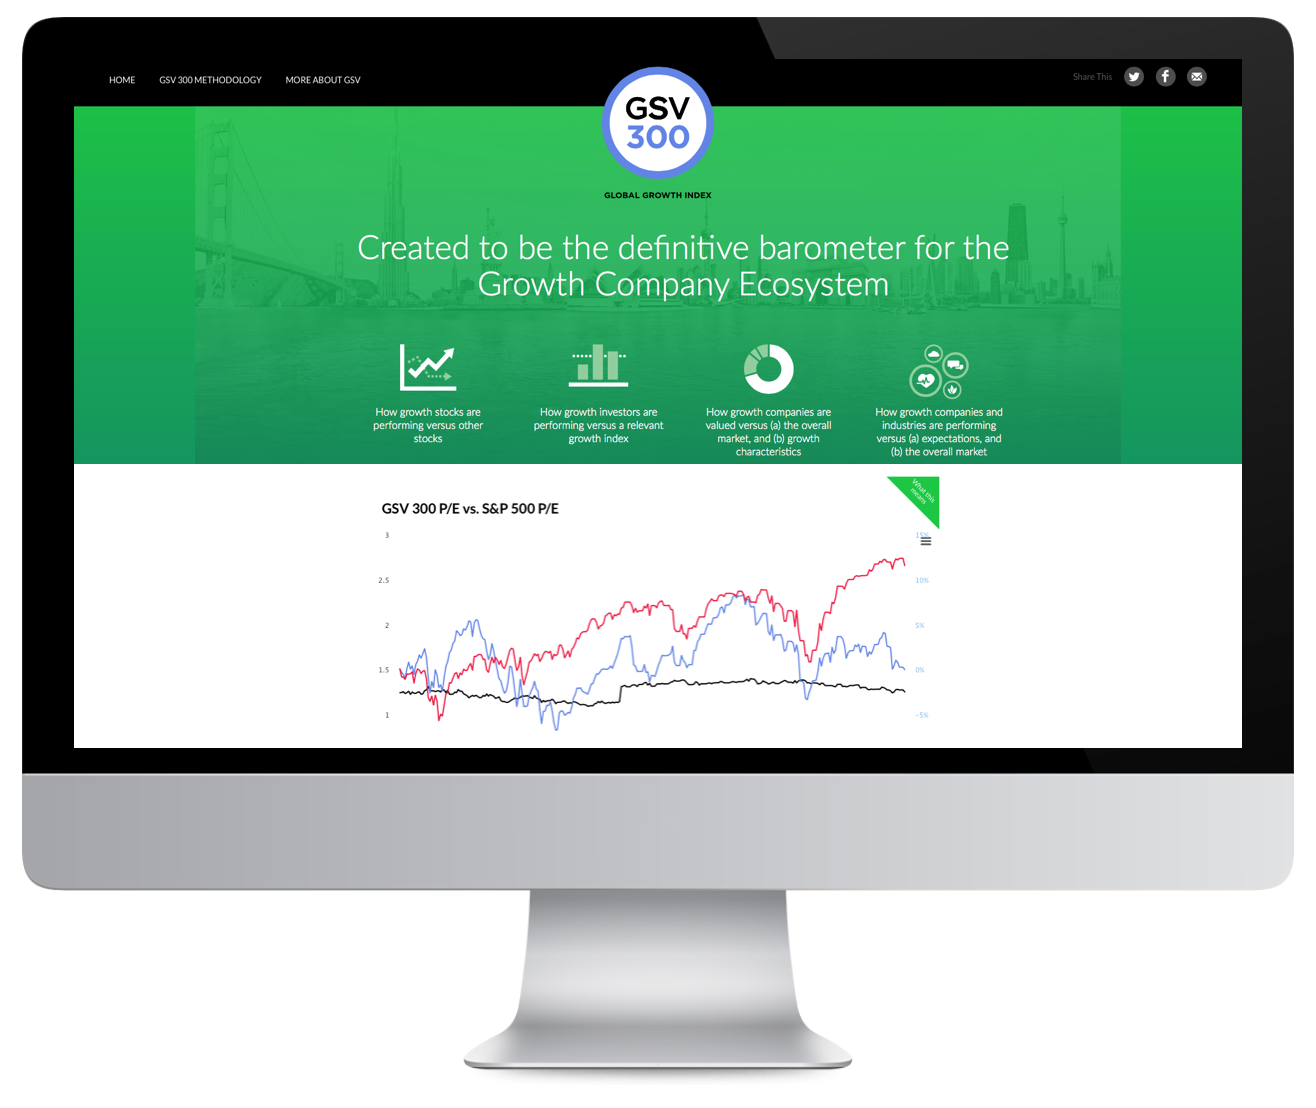
In 2015, GSV launched the GSV 300 Index, which we believe is the best representation of what is truly going on with growth companies, their valuations, and performance. It is an index of 300 of the World’s fastest growing companies, selected systematically based on key fundamentals, including revenue and earnings growth, geography, valuation metrics, and market capitalization.

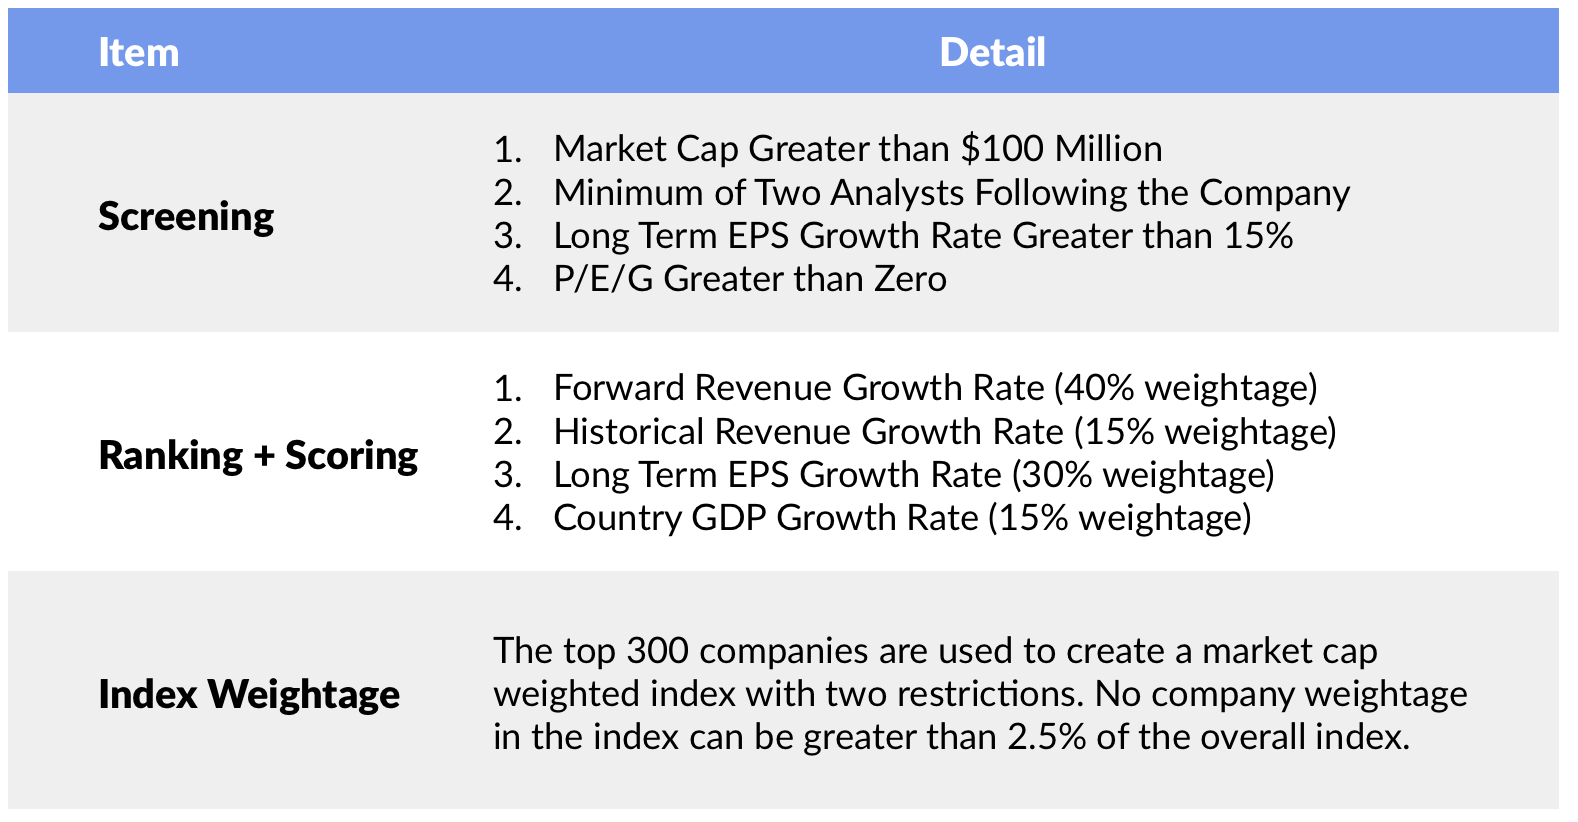
The GSV 300 Index is constructed using a three-step process, which is summarized below: Screening, Ranking + Scoring, and Index Weightage. For a full description of the GSV 300 construction methodology, please click HERE.
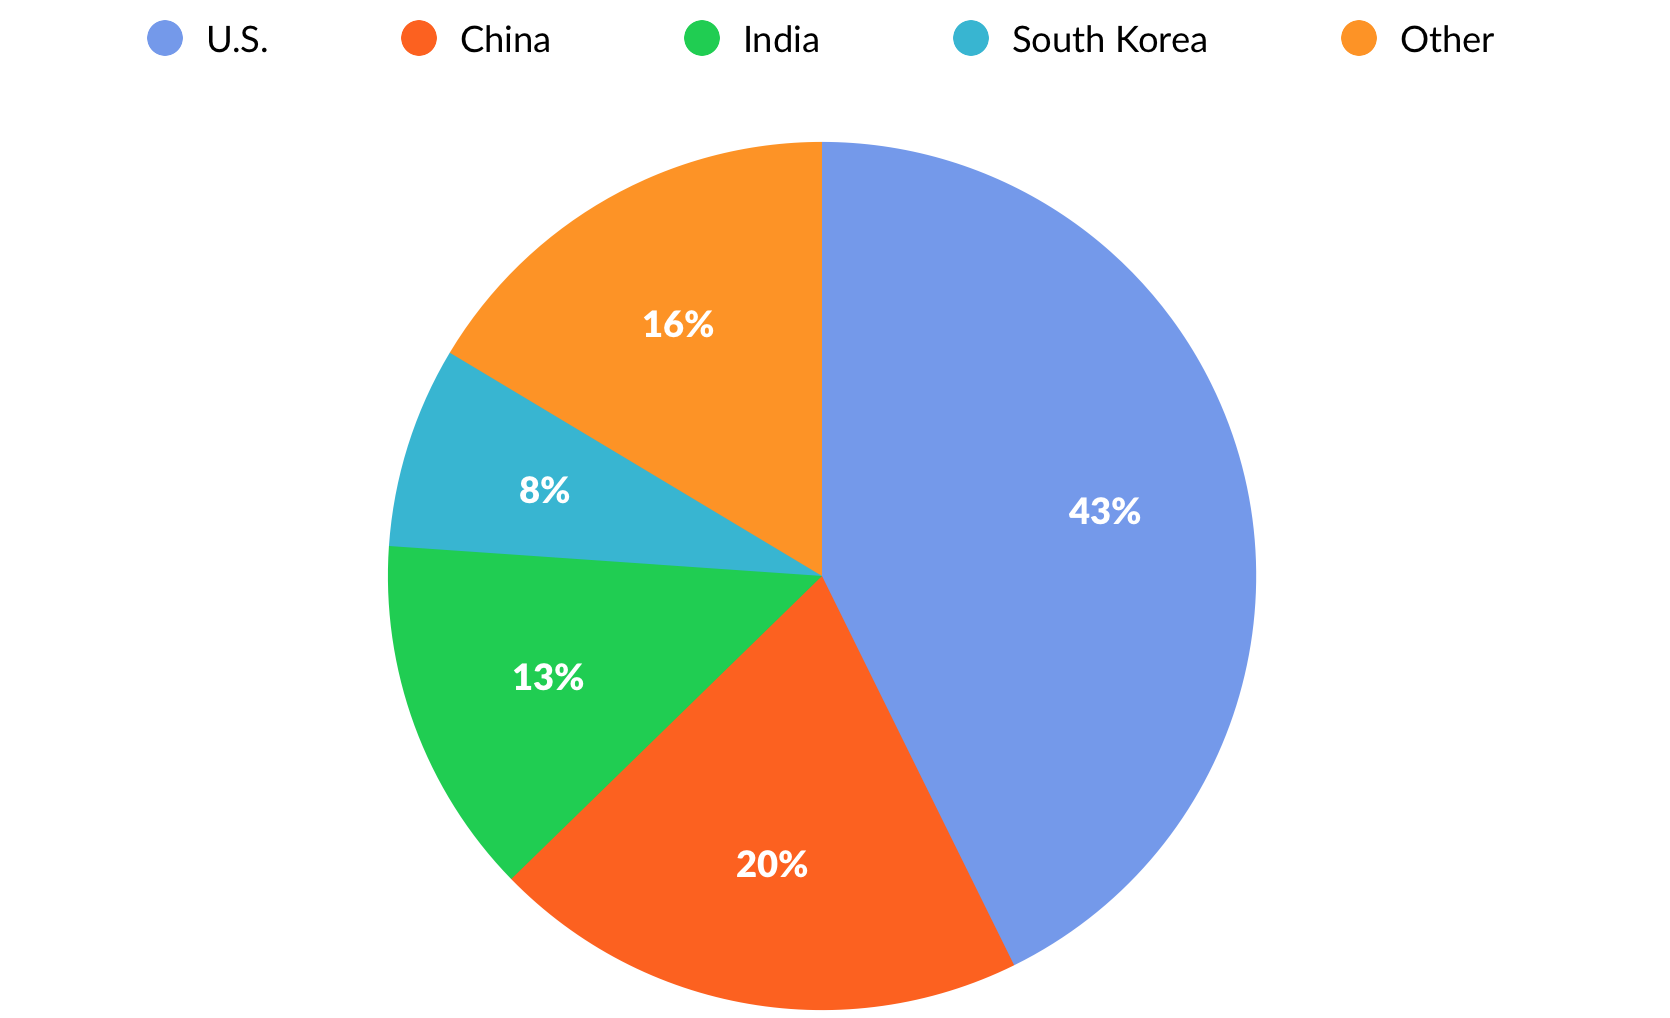
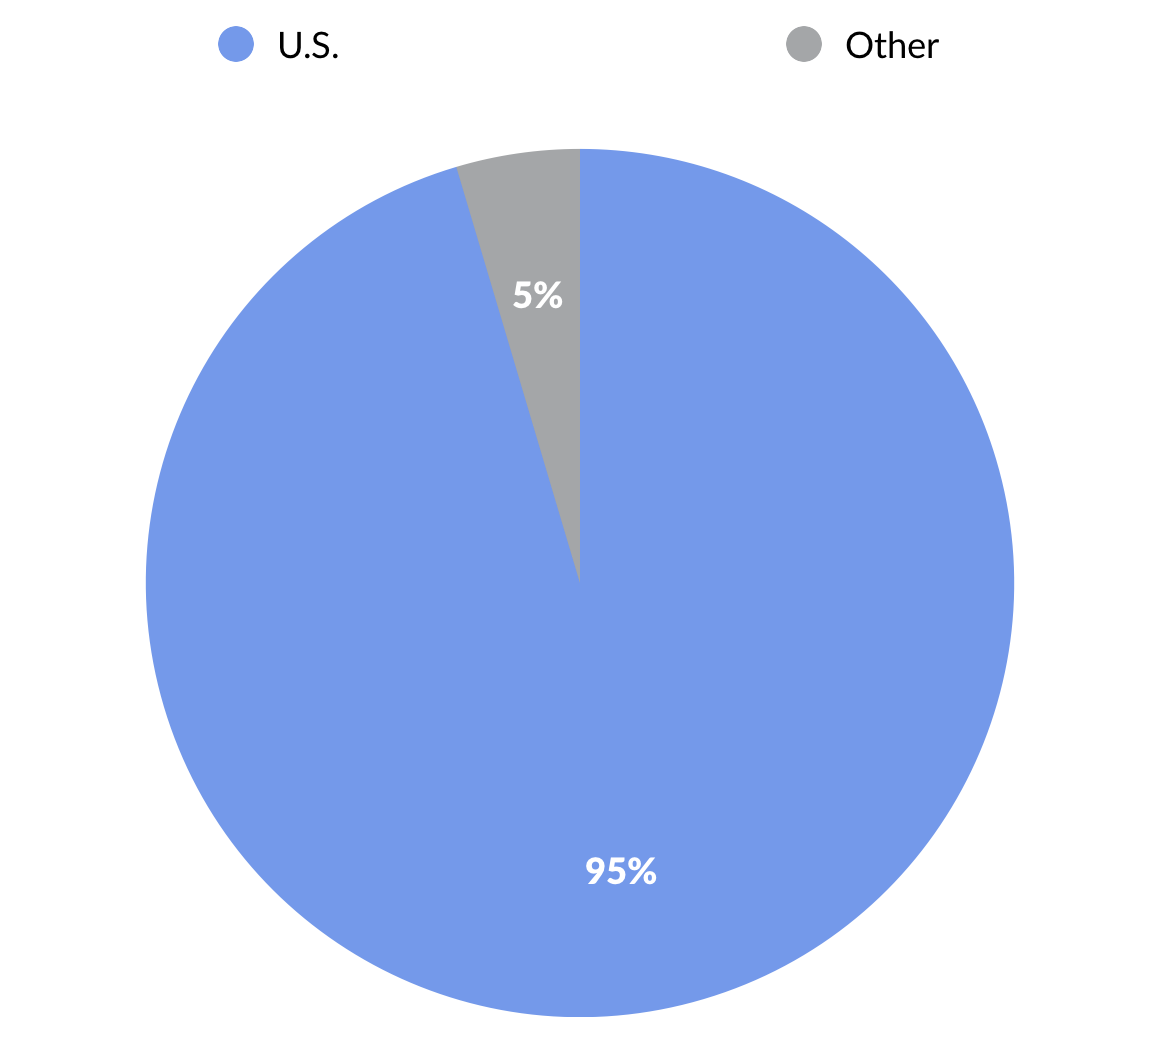
Looking at the GSV 300 by geography, 43% of the index weightage comes from U.S. companies. China is the second-largest geography at 20%, followed by India at 13%, and South Korea at 8%. By contrast, 95% of the S&P 500 and 85% of NASDAQ are represented by U.S. companies.
GSV 300 Breakdown by Country
S&P 500 Breakdown by Country
NASDAQ Breakdown by Country
Countries of NASDAQ Constituent Companies as a Percentage of Index Weightage

Source: GSViQ
Performance & Valuation
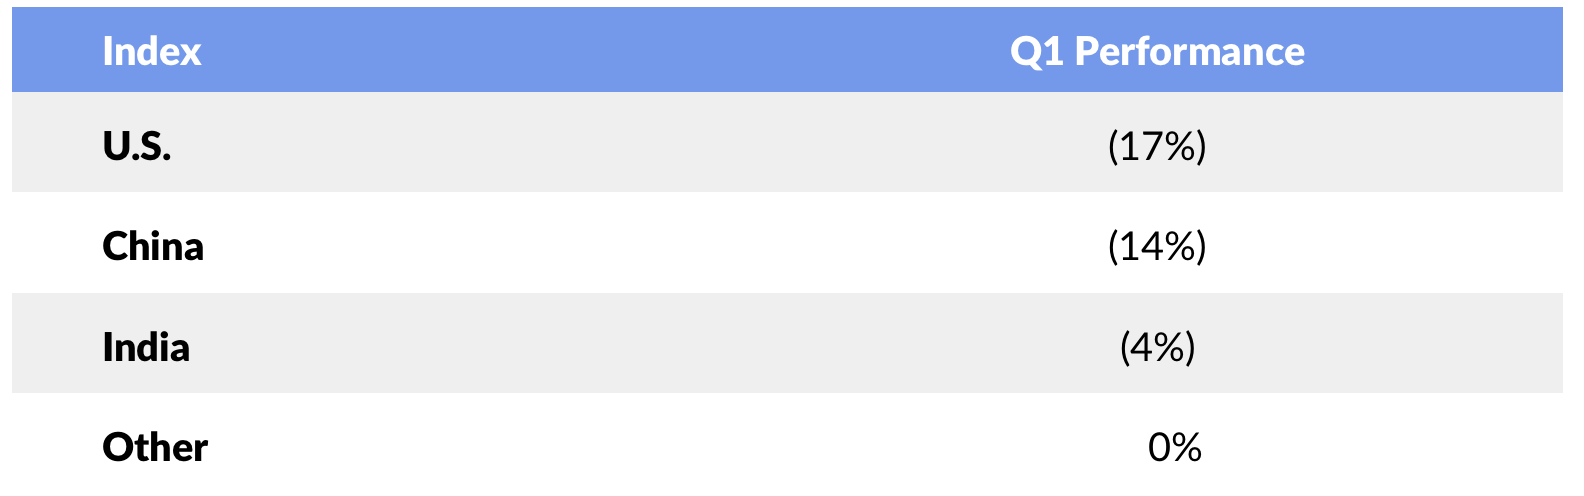
While the overall index was down by 15% for the quarter, a look at the geographic breakout indicates that the movement was largely driven by U.S. and Chinese companies, which were down 17% and 14%, respectively. India, by contrast, was only down 4%, while other geographies were flat.
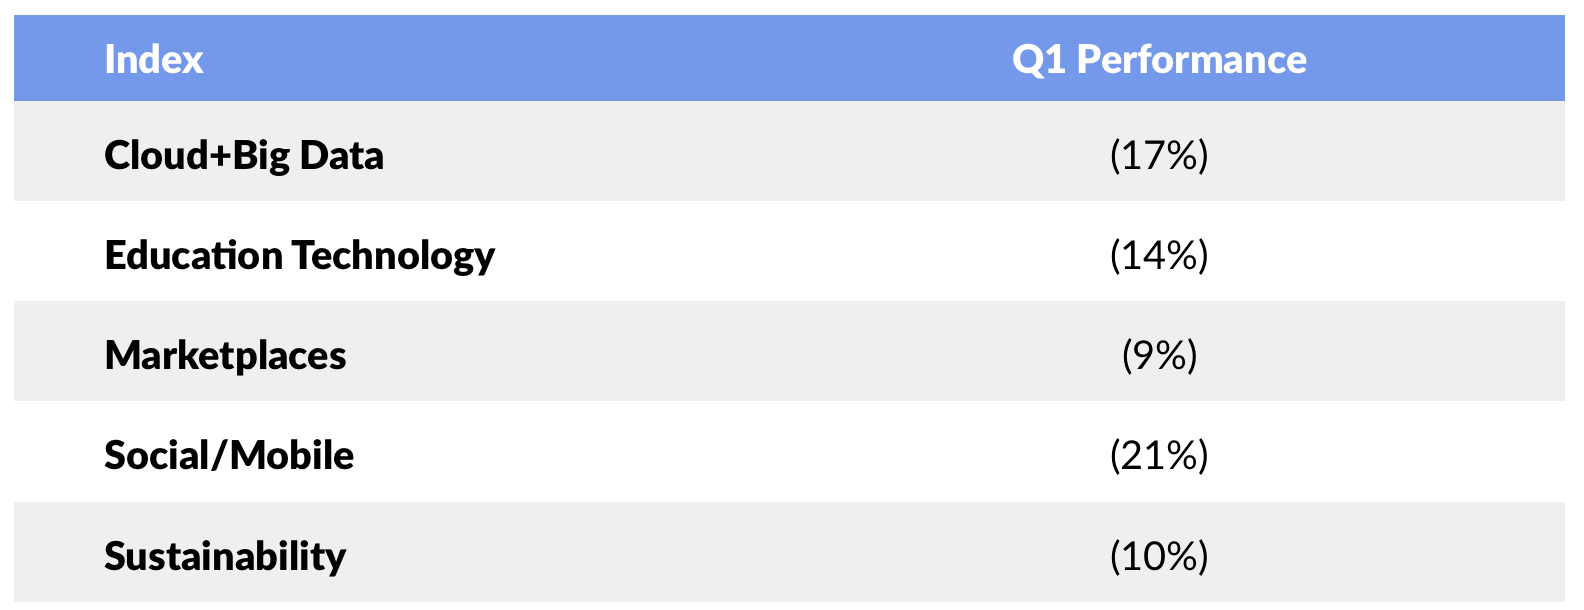
Segmented by GSV investment theme, the most significant downward movement was among “Cloud + Big Data” businesses, which were off 17%, and “Social/Mobile” businesses, which fell 21%. Much like the broader Market volatility, we expect these themes to rebound as broader growth confidence returns.
But beyond performance, we believe that the GSV 300 offers important insights about global growth companies.
The T. Rowe Price New Horizons Fund, for example, has pursued a strategy of investing in small, high-growth companies since 1961. While it is actively managed, Peter Lynch observed in Beating the Street that the fund is, “as close as you’ll get to a barometer of what is happening to emerging growth stocks.”
Since small companies are expected to grow at a faster rate than large companies, they usually sell at a higher P/E than larger companies. Logic might suggest, therefore, that the P/E of the New Horizons Fund would be higher than that of the S&P 500 at all times. This isn’t always the case, and at times when it isn’t, the New Horizons Fund can be a smoke signal for an undervalued or overheated growth economy. Over the last 50 years, for example, the New Horizons P/E has risen to double that of the S&P 500 only four times.
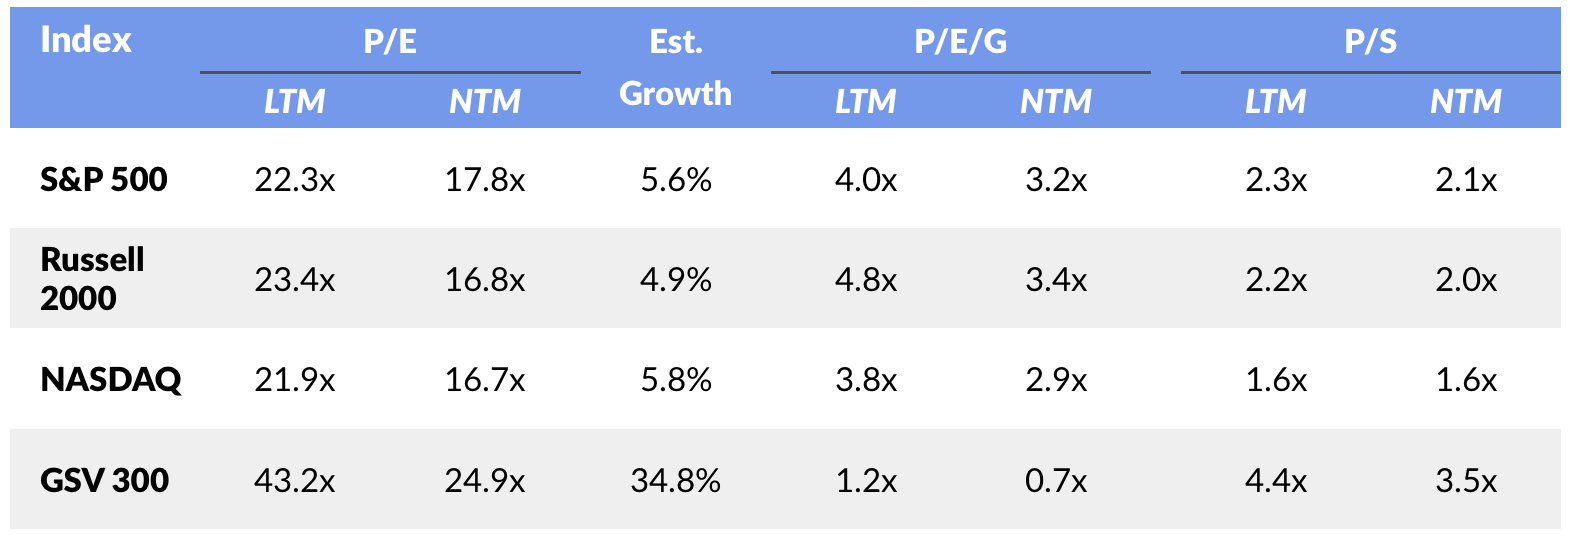
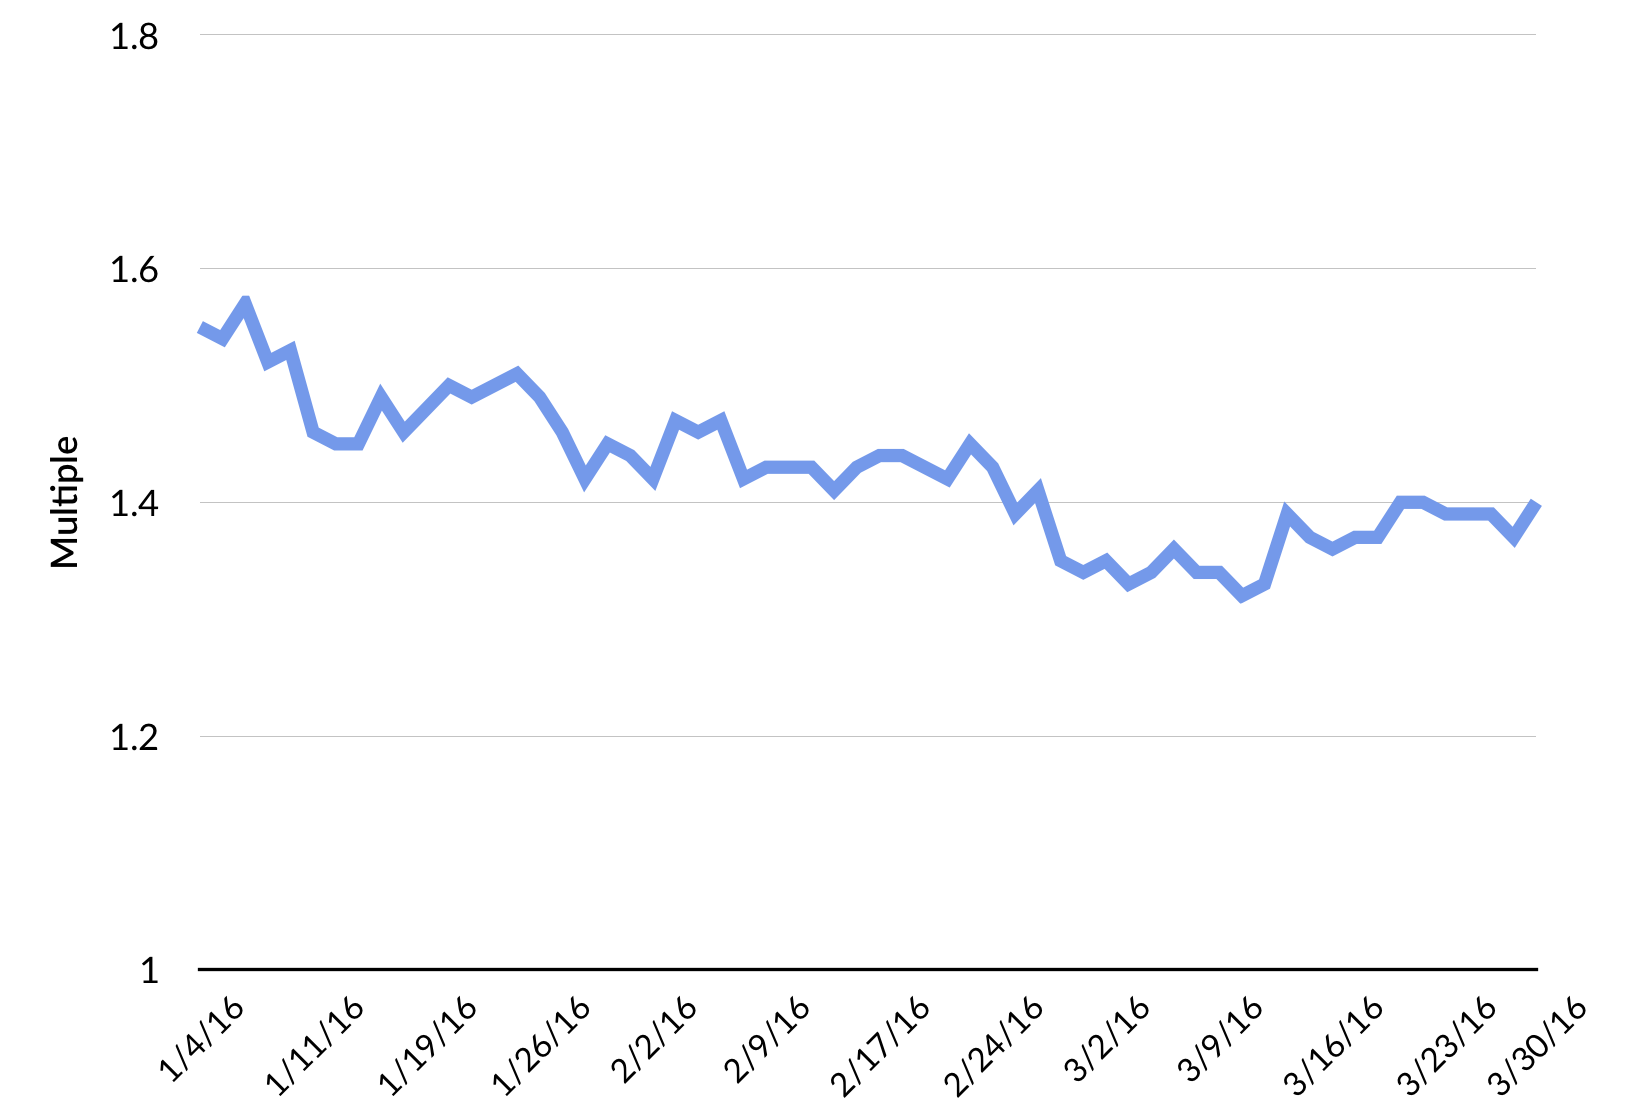
Currently, the GSV 300 has a P/E of 25x, or 1.4x greater than the S&P 500. Our thesis is that at over 2x, it’s a warning signal for growth stocks, and at under 1.2x, it’s a buying opportunity. We’ll monitor this trend, as well as the relationships of other key valuation metrics, to determine patterns over time.
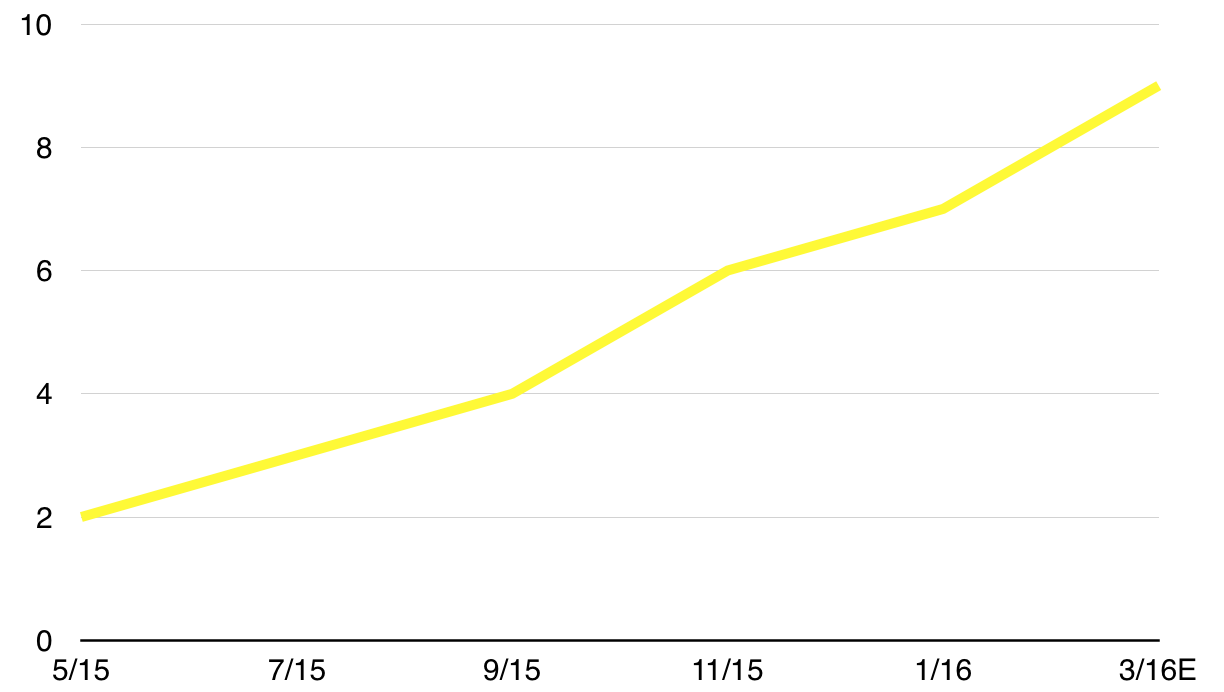
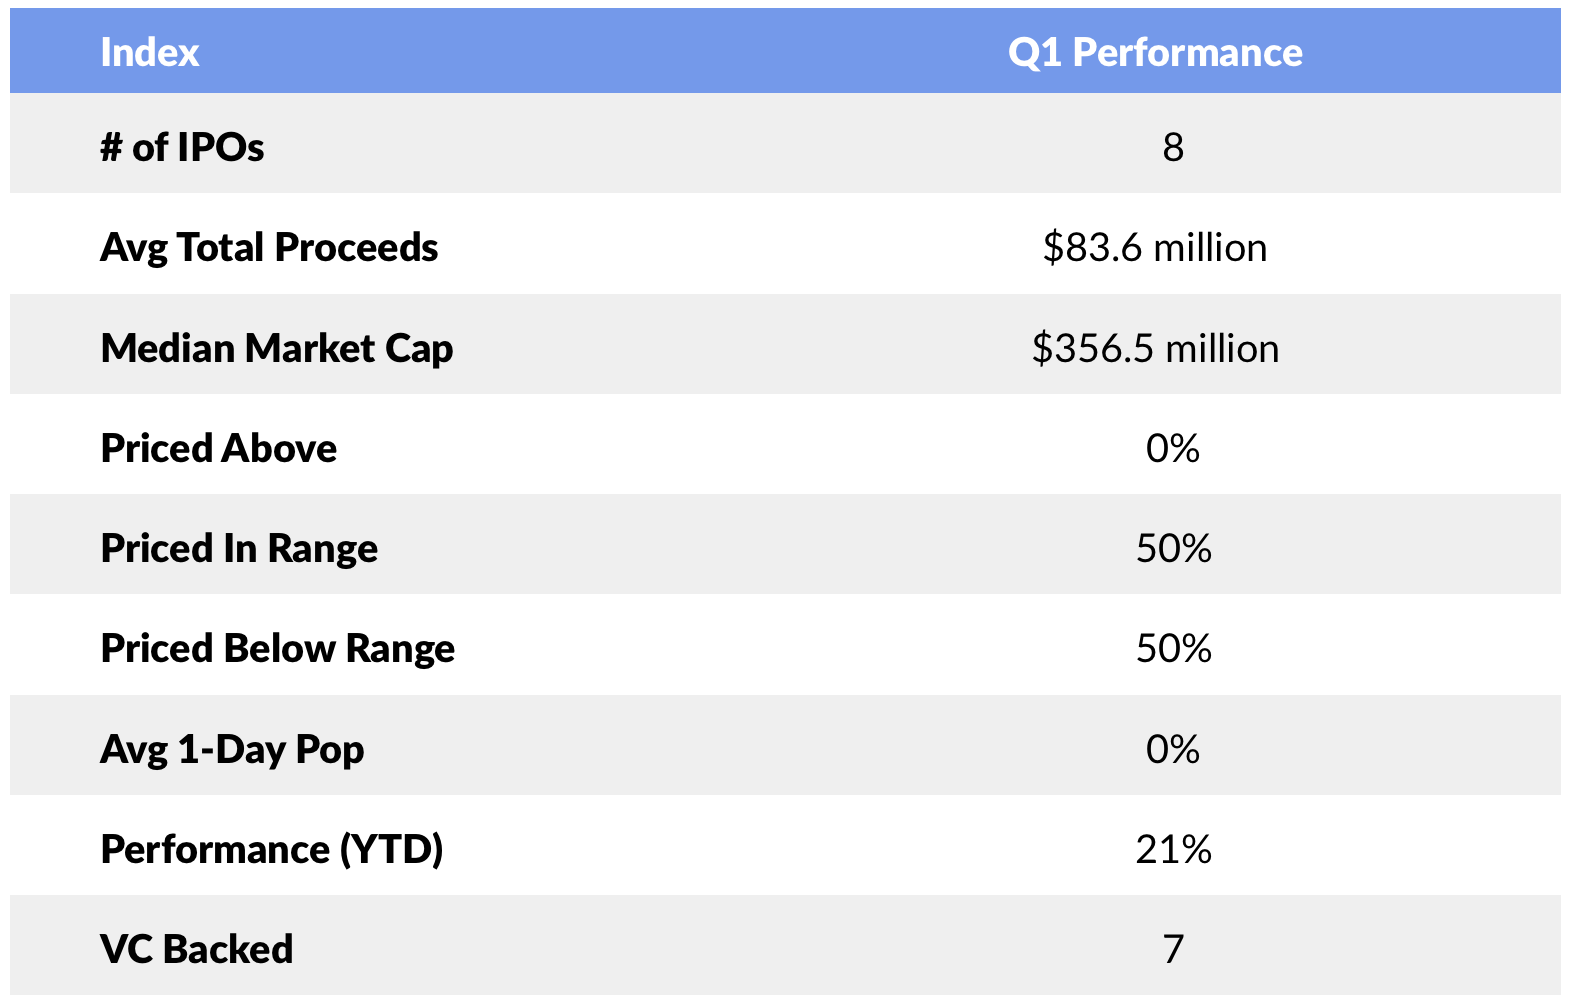
IPOs
The eight IPOs for the first quarter was the worst since the Great Recession of 2009. Given the volatility in the Market and poor performance of many new issues in 2015, it’s not a shock that there were few companies who wanted to stick their toe in the water. Given the recent improved performance of stocks, coupled with the more challenging Private Market, we expect to see an uptick in activity in the near future.
—
Last week, the Market continued its upward march in March from the depths of despair in January, with NASDAQ up 3.0%, the S&P 500 up 1.8%, and the GSV 300 advancing 2.7%. The Ten-Year Note yield was 1.8%.
With the first quarter volatility, and Mr. Market predictably behaving unpredictably, everybody knew that bond yields had nowhere to go but up. So, of course, yields went down, with the total return for bonds in the first quarter nearly 7%. Gold is the sexier version of putting your money under the mattress, but the hide-your-money strategy was up 16% for the first quarter.
Employment growth for March was a respectable 215,000 new jobs, but unemployment went from 4.9% to 5.0%. Why? Because more people started actually looking for jobs again.
Tesla continued to defy convention and announced that it had pre-ordered 180K of its new Model 3 cars in the first 48 hours. It seems like the public likes the much lower $35K starting price and 215 miles per charge. To put some perspective on that achievement, Tesla created about $7.5 billion of backlog in two days for a car that won’t be delivered for 18 months. (Disclosure: GSV owns shares in Tesla)
Bucking the trend, where a “flat” round is the new “up” round, Slack raised $200 million at a $3.8 billion valuation. Slack — which we analyze extensively in our recent A2Apple edition Slack Attack — has grown its users base from 500,000 in 2015 to 2.7 million. Early investor Accel predicts that by 2020, all organizations would be using a Slack-like product — preferably Slack.
SEC Commissioner Mary Jo White is unimpressed by recent vintages of highly valued private companies and came out to Silicon Valley last week to convert the faithful to unbelievers. We will see how that goes.
We remain BULLISH on the outlook for growth stocks despite the Market’s current adoration for more pedestrian companies. Over time, growth drives enterprise value and we believe that owning the strongest growers is the way to create superior long term returns.