Market Snapshot
| Indices | Week | YTD |
|---|
What would a great Fourth of July celebration be without some fireworks? And while our President contributed his usual pyrotechnics, including the bottle rocket he launched into China with trade, others joined the party in loud and unexpected ways.
Mexico went left at the border electing populist Andres Manuel Lopez Obrador as its President. Moreover, along with that, voters gave his Morena Party a majority in both houses of Congress and also five of the nine Governorships up for election. Mexico has been a hotbed for investment reform with major funds setting up shop in Mexico City in 2018. GSV has an “One America” theme uniting North and South America into a powerful one billion person trade zone with Mexico in the center of it. Too early to say if Mr. Lopez Obrador impacts our thesis.
Many in the U.S. are consumed by who President Trump will nominate to succeed Justice Kennedy on the Supreme Court (we will find out at 9PM Eastern Monday night). But in Poland, one-third of the Justices on their version of the Supreme Court were “retired” without them knowing about it. Accordingly, the Justices kept showing up for work which has created havoc.
Going back to our “trade war” with China — which pundits are saying is the end of civilization as we know it — U.S. stocks are essentially flat since mid-June when the War was pre-announced and the Shanghai Exchange is off nearly 10%. If stocks have any relevance in proving a score for who is winning and who is losing, so far it looks like its not the end for at least Western Civilization. Most of us are for free trade and the freer the better. But you need to make sure everybody is operating with the same definition of “free trade” and perhaps that is what the conflict is really about.
Stocks overall performed well with the Dow up 0.8%, the S&P 500 advancing 1.6% and NASDAQ continued to lead up 2.4%. 214,000 new jobs created and the surge in growth of job seekers without pay exploding were music to the Market’s ears.
Movers included Tesla, which tanked having not been able to deliver on their overall production goals for the Model 3 despite it hitting its 5,000 weekly target the last week of June. Amazon was the catalyst for drug store stocks tanking with their acquisition of PillPack. Amazon’s digital destruction is continuing in full force.
The race to a $1 trillion market capitalization had an unexpected scratch last week with Aramco — who threatened to leap frog all the competition with a rumored $2 trillion market value — being “highly likely” to drop out of the race. With oil prices at $75 a barrel, not only would Aramco been the largest market capitalization company but also the most profitable… by far.
Now left amongst the final five are Apple in front with a market value of $924 billion, Amazon which has made up enormous ground in the past 12 months with a market value of $830 billion, Alphabet at $796 billion, Microsoft at $777 billion, and Facebook way back at $588 billion but making a huge charge.

The Market prices future value into current price so it’s interesting that Apple has the lowest P/E multiple and Amazon has the highest.
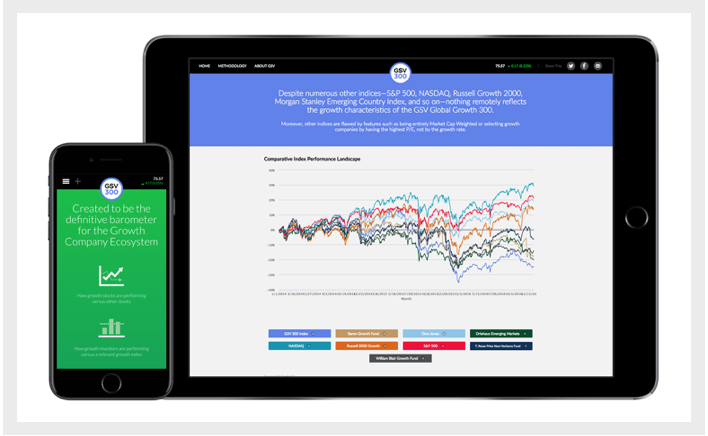
But when it comes to tracking the state of play in the global growth economy, an old saying rings true: “If you can’t measure it, you can’t manage it.”
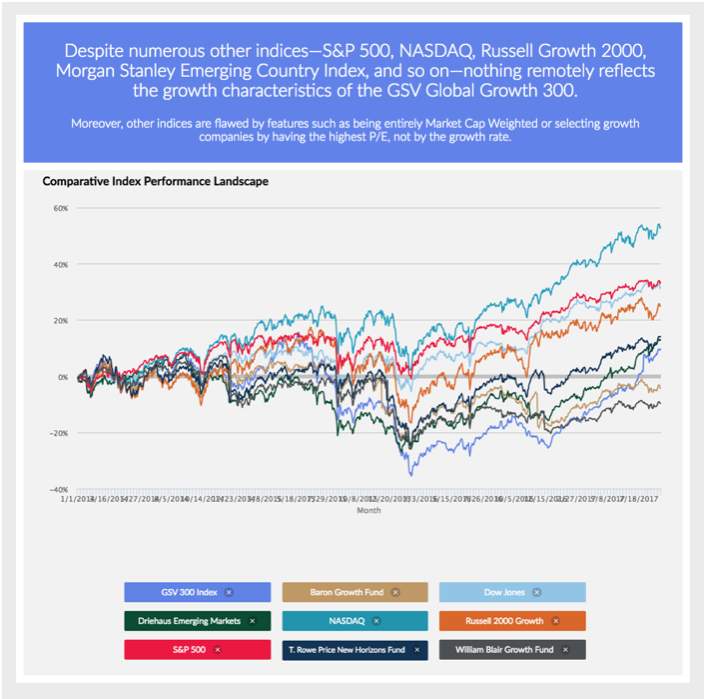
So in 2015, GSV launched the GSV 300 Index, which we believe is the best representation of what is truly going on with growth companies, their valuations, and performance. It is an index of 300 of the World’s fastest growing companies, selected systematically based on key fundamentals, including revenue and earnings growth, geography, valuation metrics, and market capitalization.

The most relevant index for Institutional Investors to date has been the S&P 500, which is a good proxy for broad Market dynamics. But with a 5% long term growth rate, it hardly reflects conditions or performance for fast growing companies.
The fact that the S&P 500 is solely a market cap weighted index is problematic in that a $100 Billion Market Cap Company has 100x the impact on the Index as a $1 Billion Market Cap Company… not realistic in that a portfolio manager who viewed two portfolio companies as being equally attractive would have 100x more of that company in their portfolio.
The most well-known index, the Dow Jones Industrial Average (DJIA), is created with an even more bizarre rationale in that it is weighted by share price. So in other words, if one stock was $30 per share and another was $300 per share, the $300 stock would have 10x the influence on the DJIA as the $30 stock.
The GSV 300, an index of the World’s 300 fastest growing public companies and a barometer for the broader Global growth economy, is up 2.5%.
The GSV 300, by contrast, is constructed using a systematic three-step process, which is summarized below: Screening, Ranking + Scoring, and Index Weightage. For a full description of the GSV 300 construction methodology, please click HERE.

GSV 300 SNAPSHOT
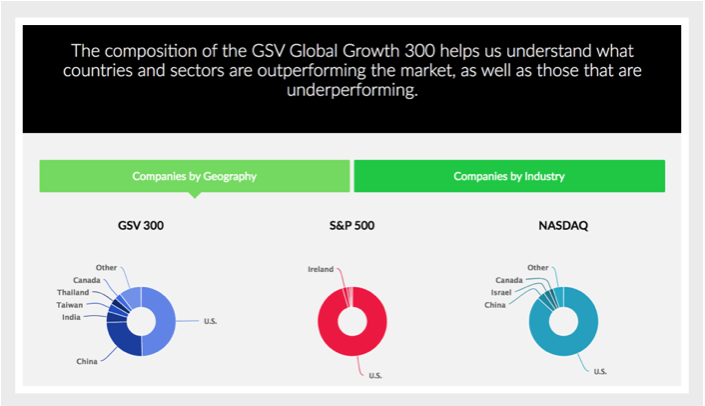
The average market capitalization of GSV 300 constituent companies is $13.6 billion, with a median of $3.2 billion. The 10 largest companies account for 25% of the index. By comparison, the top five companies in the 2,500-company NASDAQ Composite — Apple, Microsoft, Amazon, Facebook, and Alphabet (Google) — account for approximately 30% of the index alone.

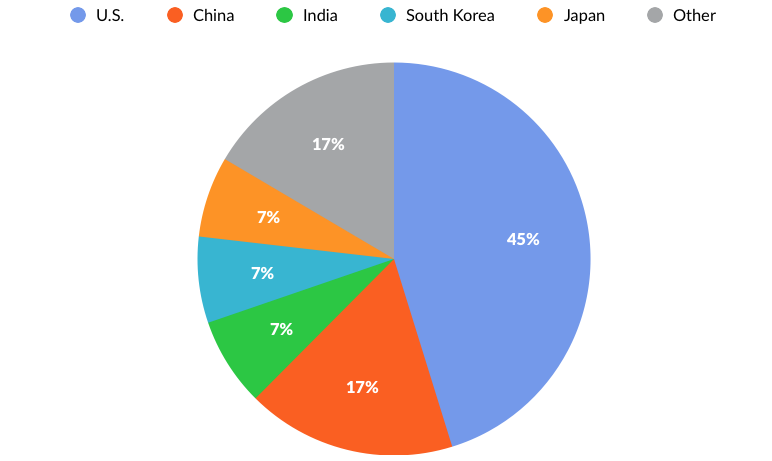
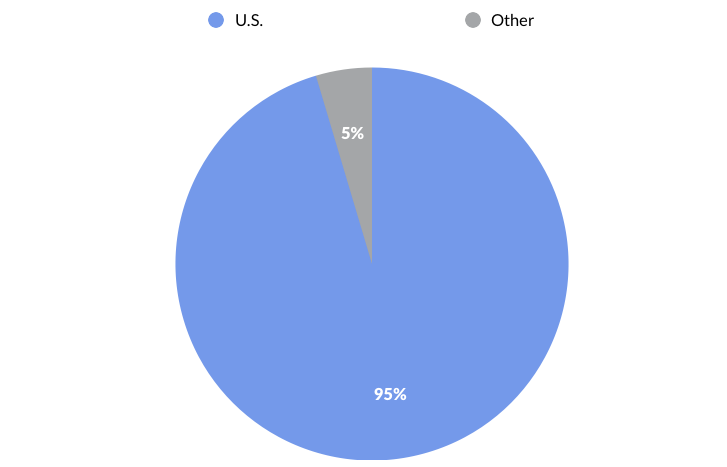
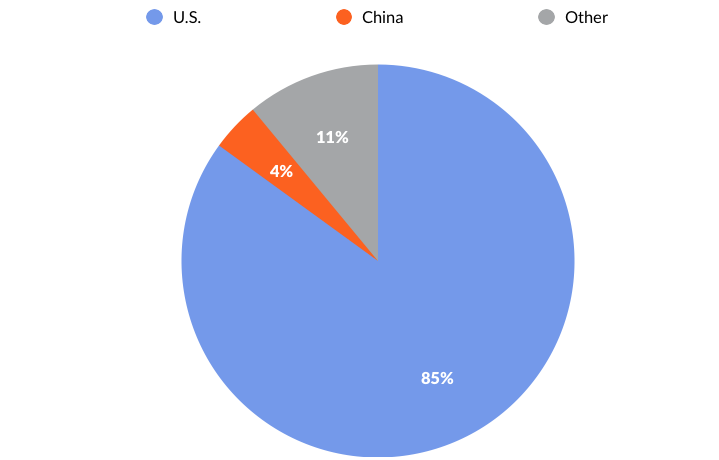
Looking at the GSV 300 by geography, 45% of the index weightage comes from U.S. companies. China is the second-largest geography at 17%, followed by India, South Korea, and Japan at 7% apiece. By contrast, 95% of the S&P 500 and 85% of NASDAQ are represented by U.S. companies.
Performance & Valuation
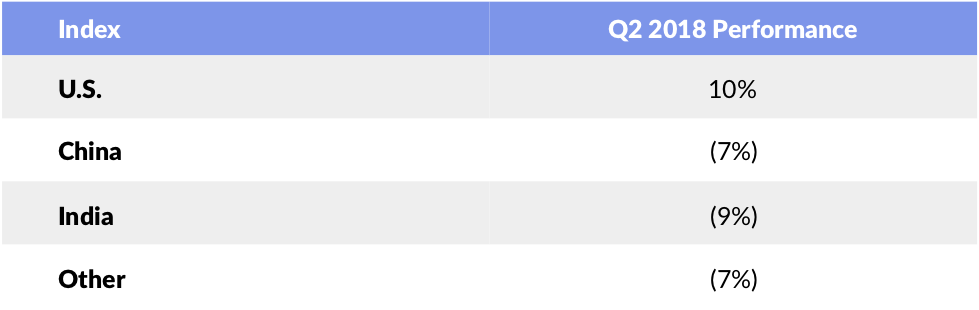
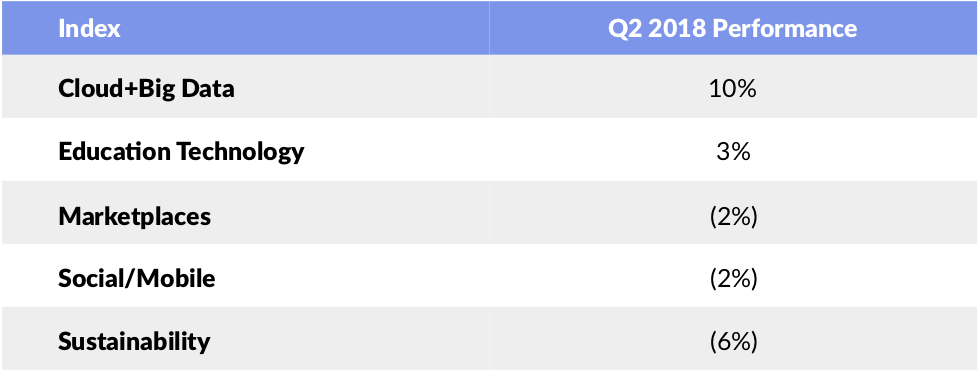
In the second quarter, the GSV 300 fell 1%, although it is up 2% for the year. While U.S. companies rose 10%, Chinese and Indian companies fell 9% and 7%, respectively. Segmented by GSV investment theme, “Cloud + Big Data” companies surged 10% and “Education Technology” rose 3%. On the flip side, “Social Mobile” and “Marketplaces” companies fell 2% respectively. “Sustainability” companies declined by 6%.
While we are certainly rooting for strong performance, our objective in launching the GSV 300 was to create a scorecard that reflects what is actually going on in the World of growth stocks.
The T. Rowe Price New Horizons Fund, for example, has pursued a strategy of investing in small, high-growth companies since 1961. While it is actively managed, Peter Lynch observed in Beating the Street that the fund is, “as close as you’ll get to a barometer of what is happening to emerging growth stocks.”
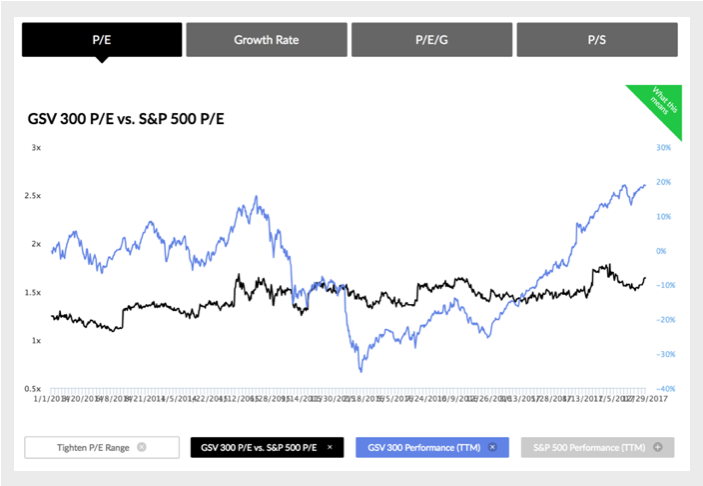
Since small companies are expected to grow at a faster rate than large companies, they usually sell at a higher P/E than larger companies. Logic might suggest, therefore, that the P/E of the New Horizons Fund would be higher than that of the S&P 500 at all times.
This isn’t always the case, and at times when it isn’t, the New Horizons Fund can be a smoke signal for an undervalued or overheated growth economy. Over the last 50 years, for example, the New Horizons P/E has risen to double that of the S&P 500 only four times.
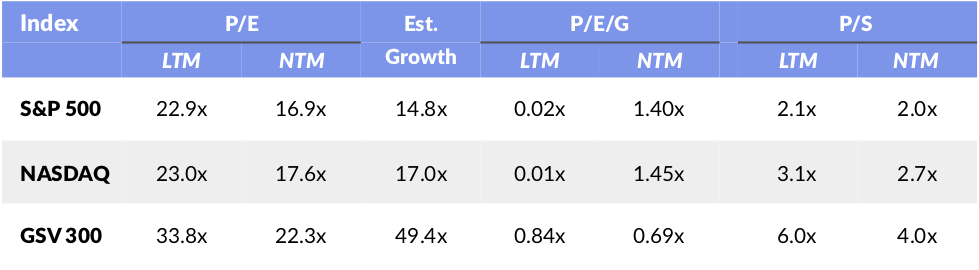
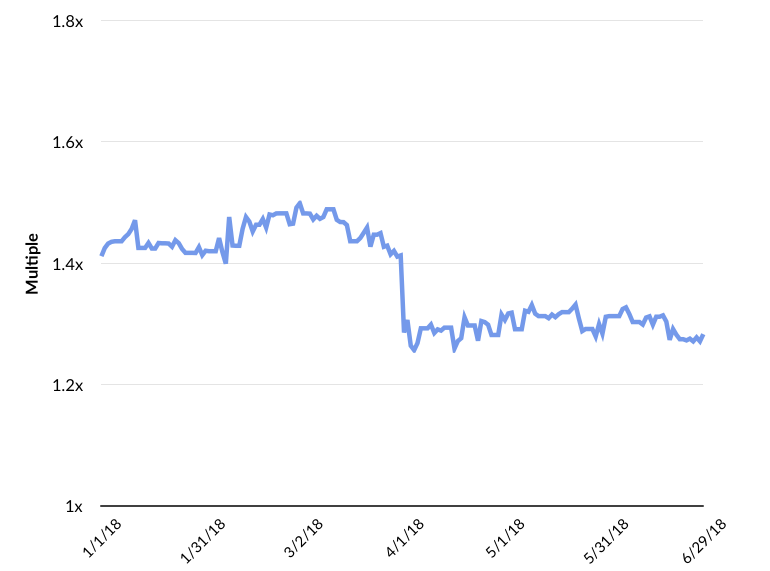
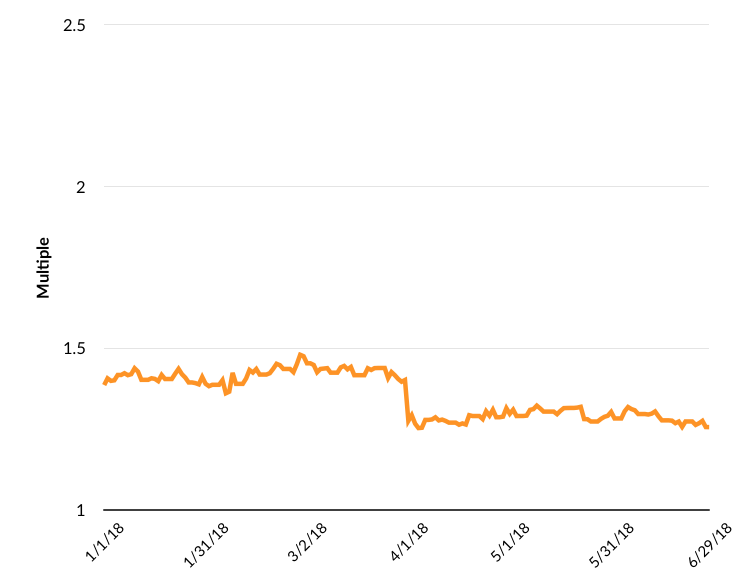
Currently, the GSV 300 has a P/E (forward) of 22.3, or 1.3x greater than the S&P 500. Our thesis is that at over 2x, it’s a warning signal for growth stocks, and at under 1.2x, it’s a buying opportunity. We’ll monitor this trend, as well as the relationships of other key valuation metrics, to determine patterns over time.
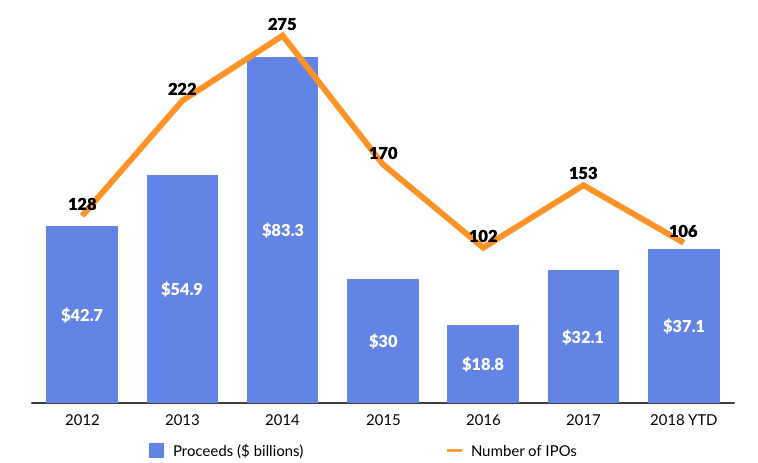
2018 IPO RECAP
The Stock Market reflects the confidence investors have in the future, and the IPO market is an even more acute indicator. If investors are pessimistic, new issues shut down. If investors are optimistic, they treat IPOs like fresh oxygen that they can’t get enough of.
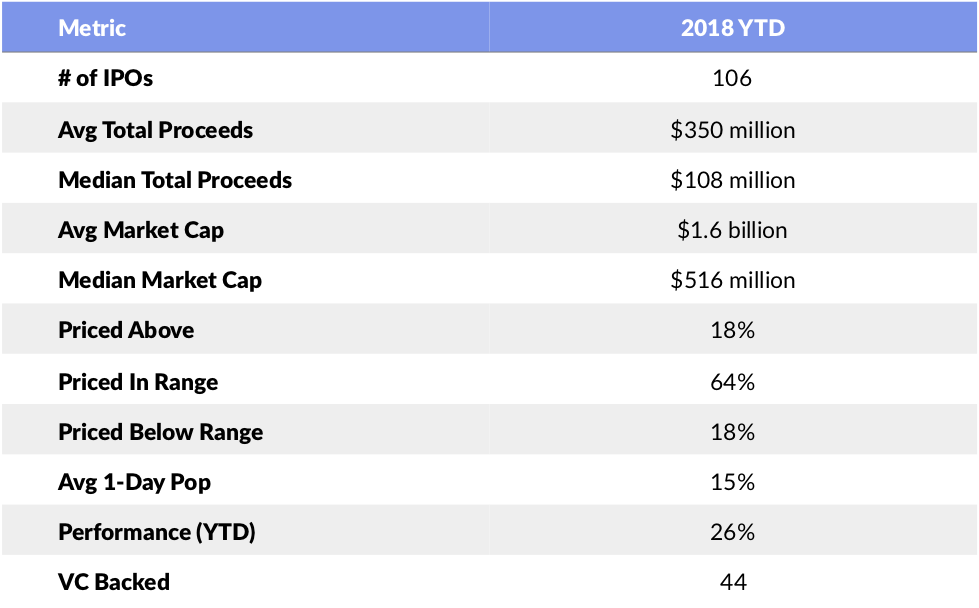
Compared to recent years, the IPO market is thriving in 2018. To date, 106 companies have gone public — a 47% year-over-year increase — raising a combined $37 billion in proceeds. That’s up 111% versus the same time last year and more than the full year total for 2017.
There were 44 VC-backed IPOs, a 57% year-over-year increase. Nineteen companies priced above range, 68 companies priced in range, and nineteen companies priced below range. The average one-day pop stands at 15%.
In a normal IPO market, you’d expect to see approximately 20% of new issues to price about the IPO filing range, 20% to price below and 60% to price within. Additionally, we’d expect to first day pop to be within 10% to 15%. If the market performed materially different than that, then it is a signal for investors to pay close attention.
For example, if 50% of new issues were pricing above the range and were trading on average of 30%, that would be a classic sign that the market is getting overheated and that we should be cautious. On the flip side, if 50% of new issues were pricing below the range and were trading down, it would be a sign that investors were being over-bearish and that there could be opportunities. (The time to be fearful is when others are being greedy and to be greedy when others are fearful.)
So, while the IPO market has picked up materially, given how new issues are pricing and trading, we think we are in a normal and healthy territory.
Dropbox and Spotify have been the headliners of this healthy growth environment. Since its IPO in March, Dropbox is up 49%. Spotify, which executed a successful direct listing in April, has thrived in its debuts a public company, rising approximately 20% to date and surpassing $30 billion in market value.
DBX and SPOT have been the perfect shot in the arm to keep marks moving the right way. Two weeks ago, there were 13 companies that went public, raising a combined $2.3 billion in proceeds. It was the first week to have more than ten companies go public since November 2014.
Notable technology IPOs in Q2 include education technology company PluralSight (+29% since IPO), enterprise SaaS platform Zuora (+88% since IPO), business intelligence company Domo (+4% since IPO), and electronic signature provider DocuSign (+89% since IPO). Notable technology IPOs on deck in the U.S. include SurveyMonkey and Sonos.
Netherland-based company Adyen also went public, choosing to list in Europe as opposed to the United States. Adyen is Europe’s leading fintech and payment platform and has performed 110% since making its public debut.
In the Middle Kingdom, high flying Chinese Unicorns Xiaomi (smartphone maker), Meituan (food delivery service), Tencent Music (music social network) and DiDi (on-demand transportation), are all poised to make their public debuts in the coming days and weeks.
Xiaomi is poised to begin trading on Monday, pricing its public offering at the low end of the expected range. Xiaomi originally sought a market valuation of $100 billion in its IPO, but it has been scaled back $54 billion. The company was last valued in the private markets at $46 billion.
Tencent-backed food delivery service Meituan is reportedly seeking a valuation of $60 billion in its IPO. DiDi is eyeing an $80 billion IPO. Tencent Music is targeting $30 billion.
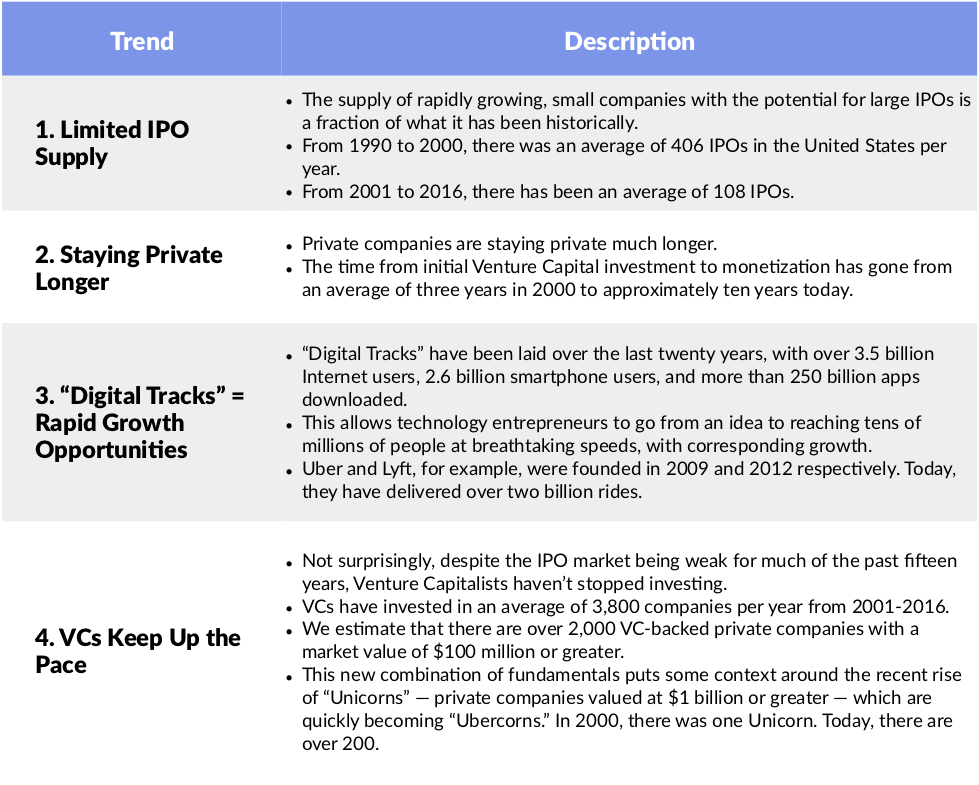
While we were pleased to see improving IPO activity in 2018, it’s important to remember how much further this rebound could go. The recent trend points to a broader opportunity for the best names to break through an IPO backlog that has been building over the last fifteen years.
According to data from the National Venture Capital Association, from 1990 to 2000, there was an average of 406 IPOs in the United States per year. From 2001 to 2016, it dropped to 108.