Market Snapshot
| Indices | Week | YTD |
|---|
This week, the royalty of international politics, business, and finance will make their annual pilgrimage to Davos for the 2018 World Economic Forum. The theme of the 48th annual meeting is “Creating a Shared Future in a Fractured World.”
With Donald Trump set to become the first U.S. president to attend Davos in two decades, it’s doubtful that the audience will be gaga for MAGA.
While 2017 was a rollercoaster if you read the headlines, it was a banner year for the global growth economy. The S&P 500 was up 19.4%, NASDAQ was up 28.2%, and the Dow Jones was up 25.1%. China’s SSE Composite Index was up 6.6%, Hong Kong’s Heng Seng has jumped 36.0%, and India’s Sensex was up 27.9%.

The most relevant index for Institutional Investors to date has been the S&P 500, which is a good proxy for broad Market dynamics. But with a 5% long term growth rate, it hardly reflects conditions or performance for fast growing companies.
The fact that the S&P 500 is solely a market cap weighted index is problematic in that a $100 Billion Market Cap Company has 100x the impact on the Index as a $1 Billion Market Cap Company… not realistic in that a portfolio manager who viewed two portfolio companies as being equally attractive would have 100x more of that company in their portfolio.
The most well-known index, the Dow Jones Industrial Average (DJIA), is created with an even more bizarre rationale in that it is weighted by share price. So in other words, if one stock was $30 per share and another was $300 per share, the $300 stock would have 10x the influence on the DJIA as the $30 stock.
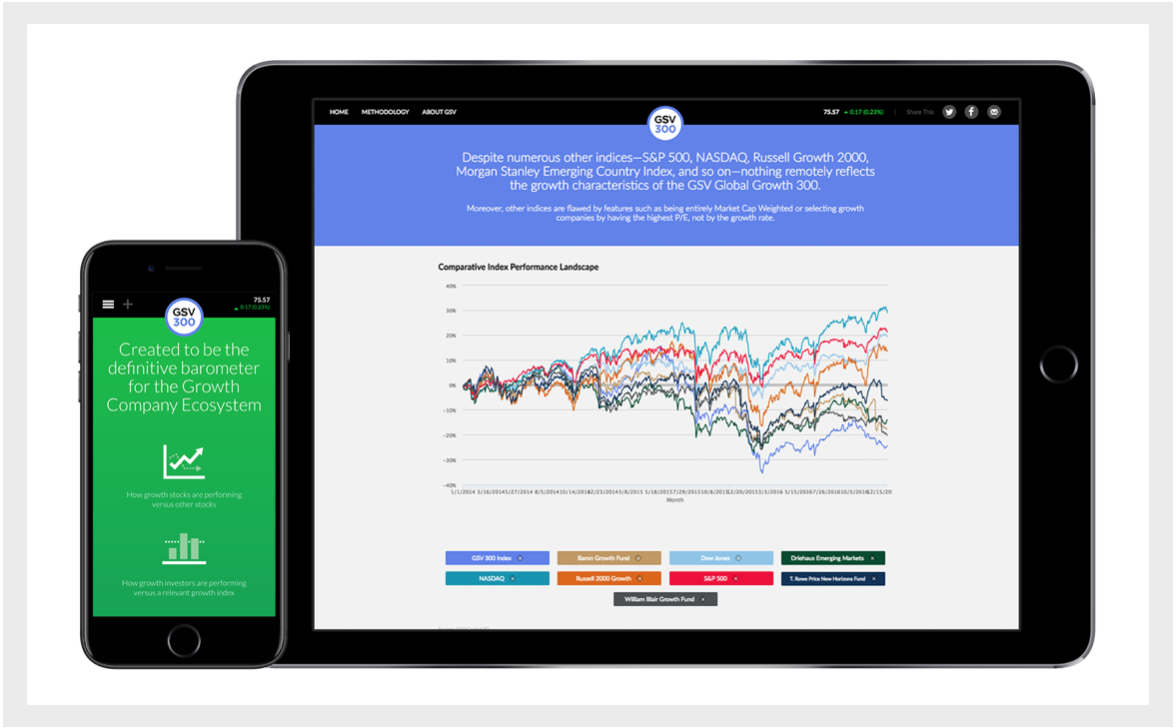
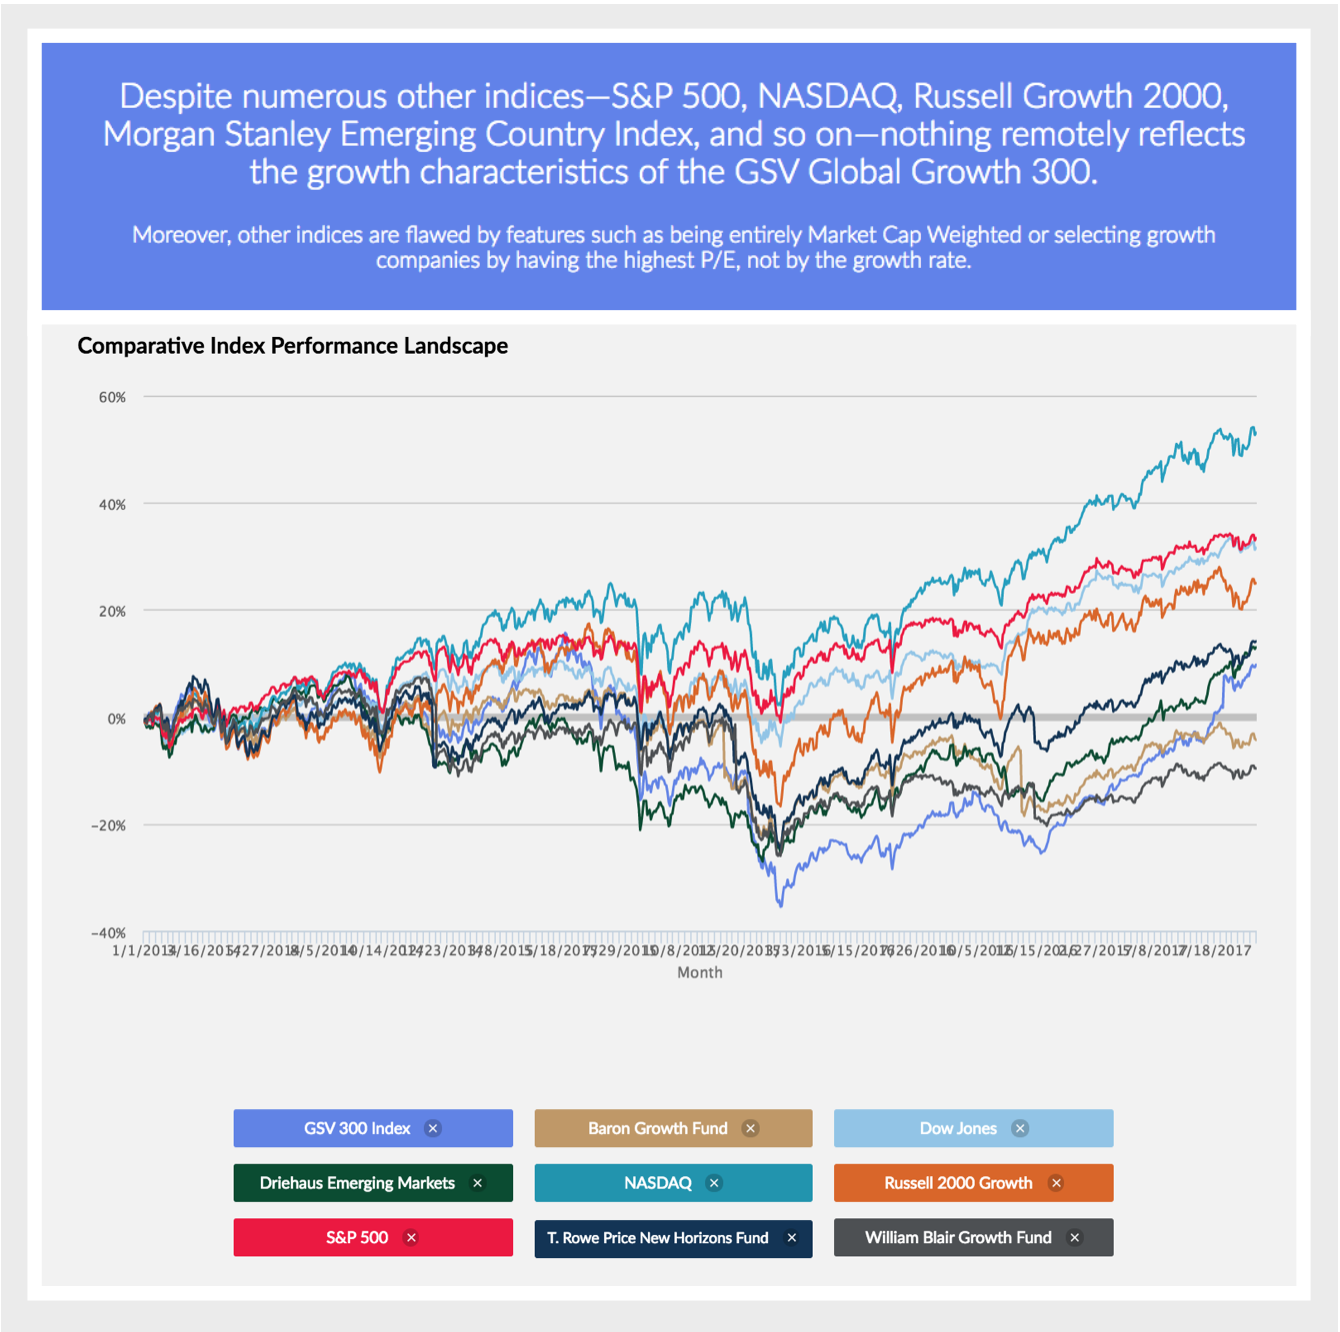
The GSV 300, an index of the World’s 300 fastest growing public companies and a barometer for the broader Global growth economy, soared 57.1%.
The GSV 300, by contrast, is constructed using a systematic three-step process, which is summarized below: Screening, Ranking + Scoring, and Index Weightage. For a full description of the GSV 300 construction methodology, please click HERE.

GSV 300 Snapshot
The average market capitalization of GSV 300 constituent companies is $13.9 billion, with a median of $2.7 billion. The 10 largest companies account for 25% of the index. By comparison, the top five companies in the 2,500-company NASDAQ Composite — Apple, Microsoft, Amazon, Facebook, and Alphabet (Google) — account for approximately 30% of the index alone.

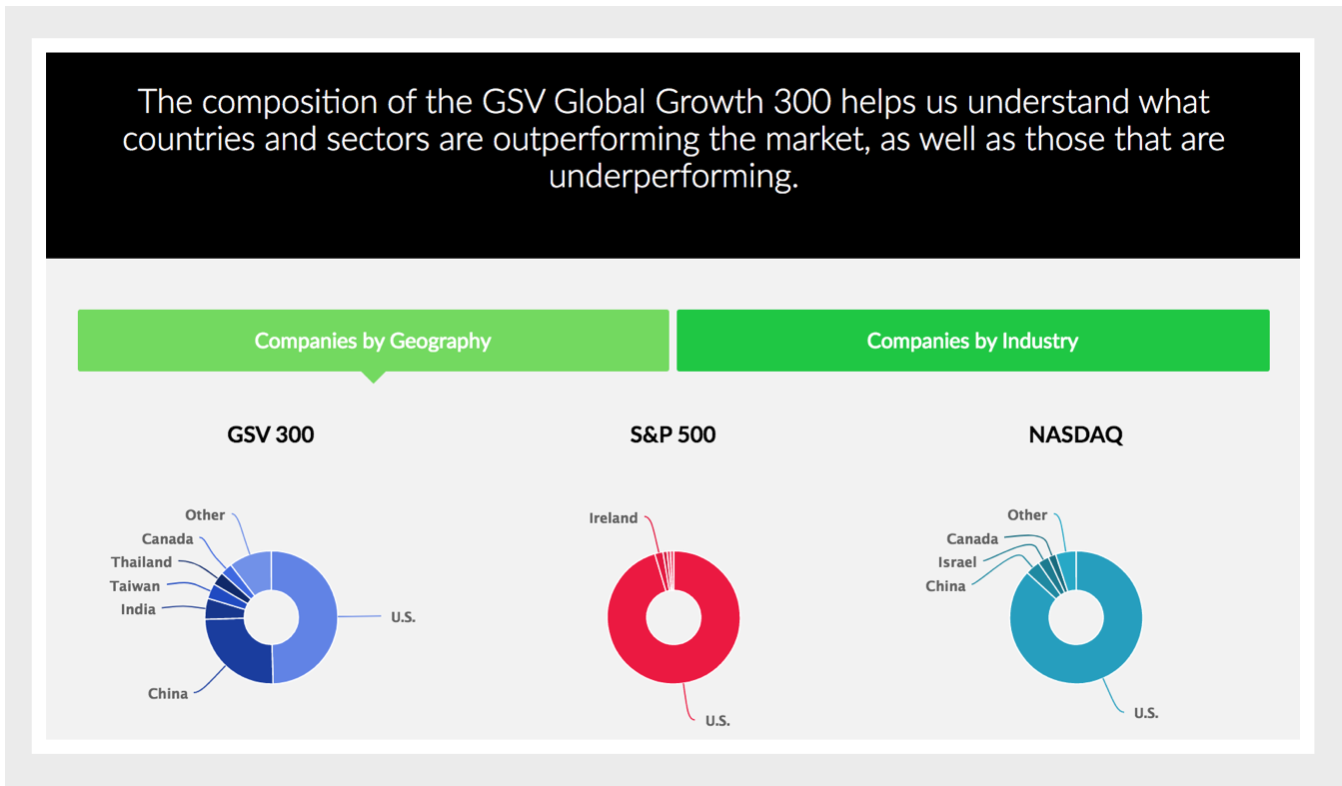
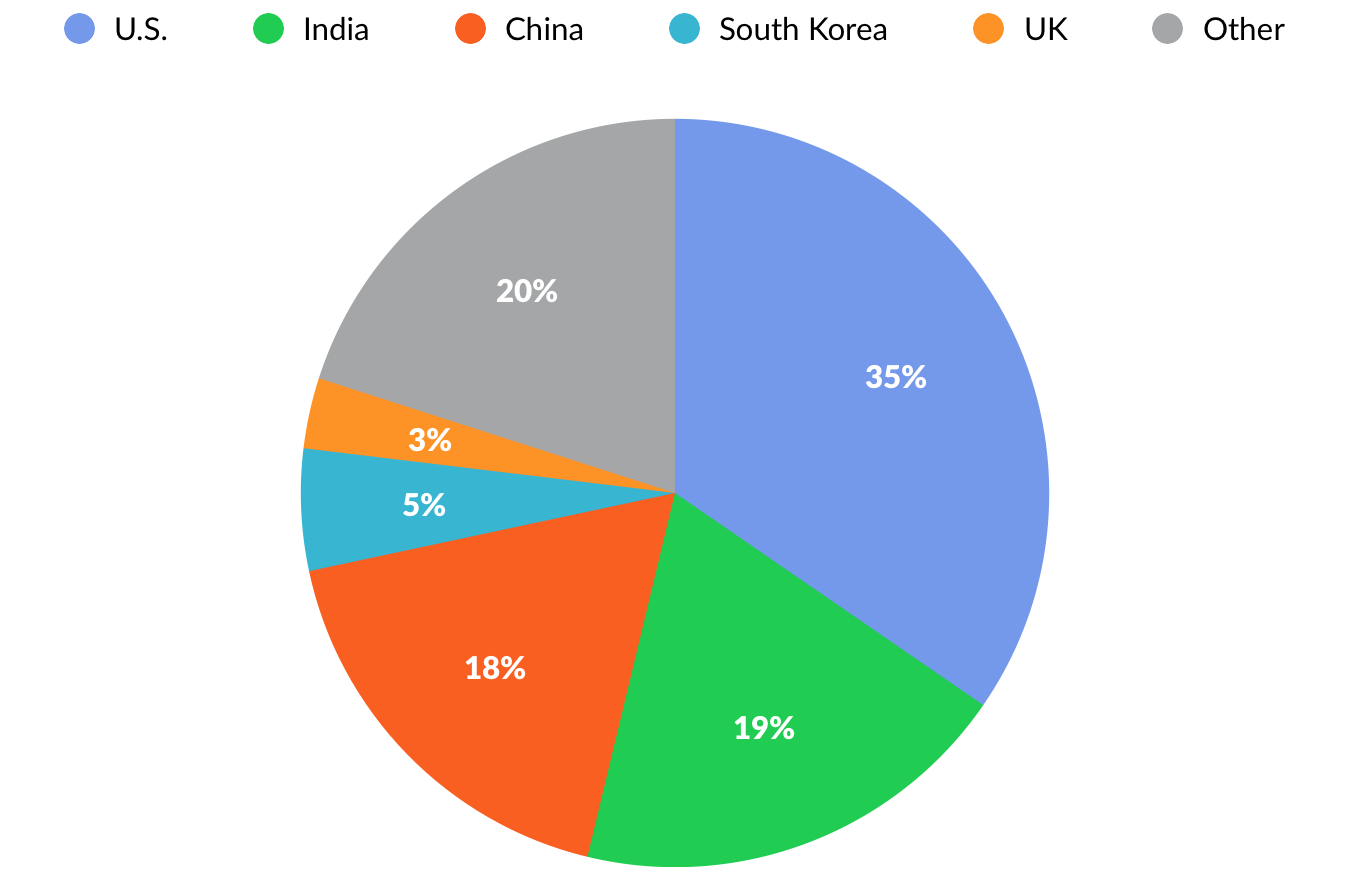
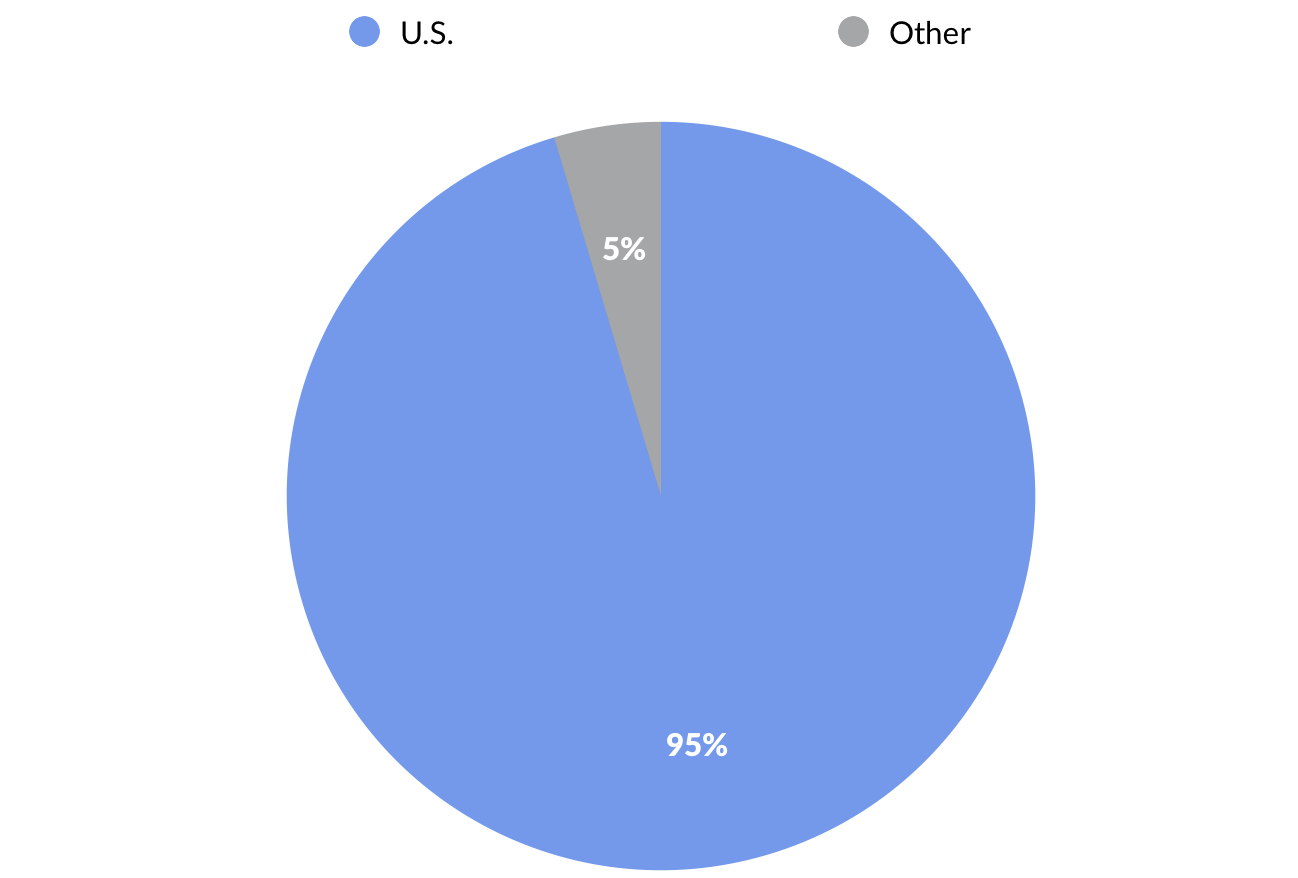
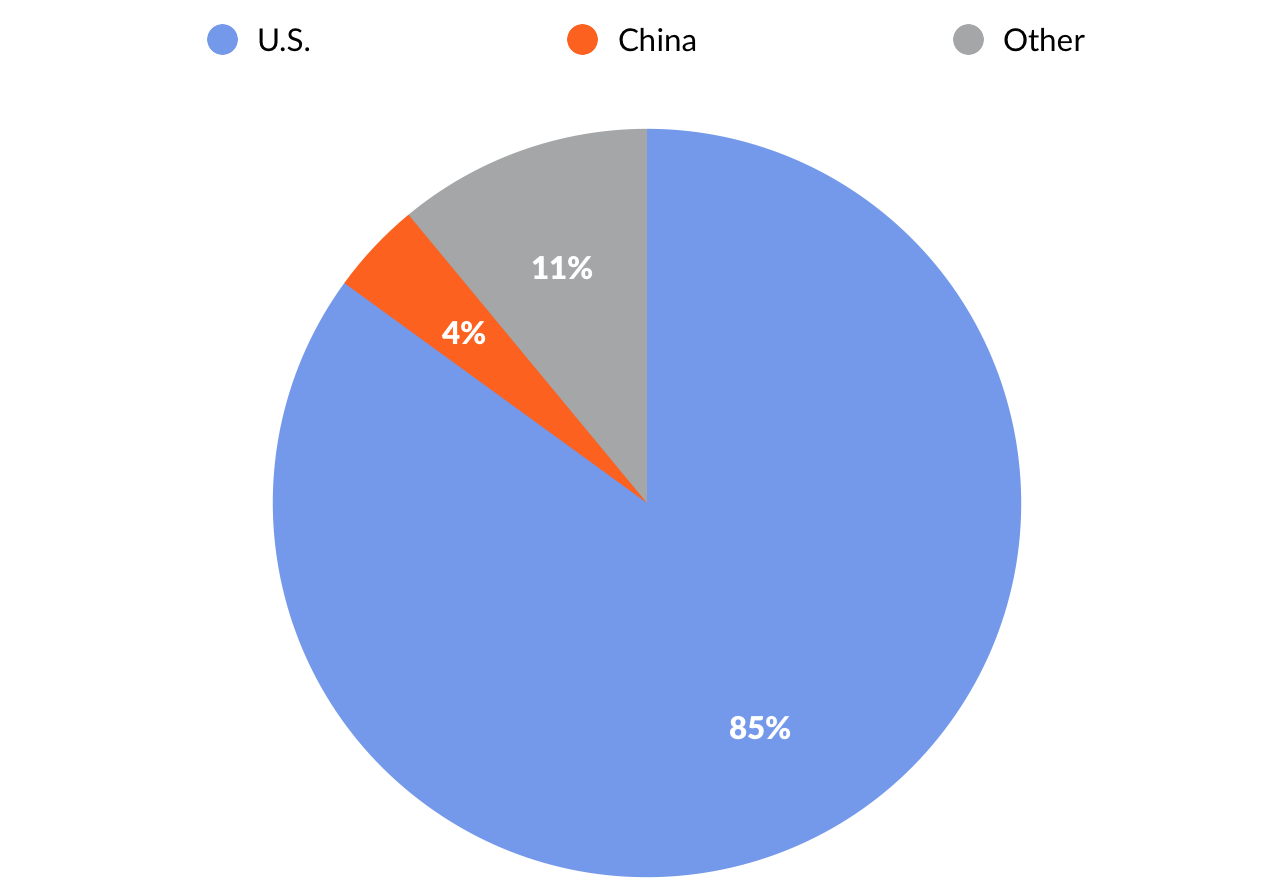
Looking at the GSV 300 by geography, 35% of the index weightage comes from U.S. companies. India is the second-largest geography at 19%, followed by China at 18%. South Korea and the United Kingdom round out the top five, contributing 5% and 3%, respectively. By contrast, 95% of the S&P 500 and 85% of NASDAQ are represented by U.S. companies.
Performance & Valuation
For the fourth quarter, the GSV 300 rose 11%, with Indian companies driving the action, rising 11%. U.S. and Chinese companies were up 6% respectively. Segmented by GSV investment theme, “Social Mobile” companies rose 12%, “Cloud + Big Data” companies gained 8%, “Marketplaces” were up 5%, and “Sustainability” companies were flat. “Education“ companies declined by 3%.


For the year, the GSV 300 was up a staggering 57%. While we’re certainly rooting for strong performance, our objective in launching the index was to create a scorecard that reflects what is actually going on in the World of growth stocks.
The T. Rowe Price New Horizons Fund, for example, has pursued a strategy of investing in small, high-growth companies since 1961. While it is actively managed, Peter Lynch observed in Beating the Street that the fund is, “as close as you’ll get to a barometer of what is happening to emerging growth stocks.”
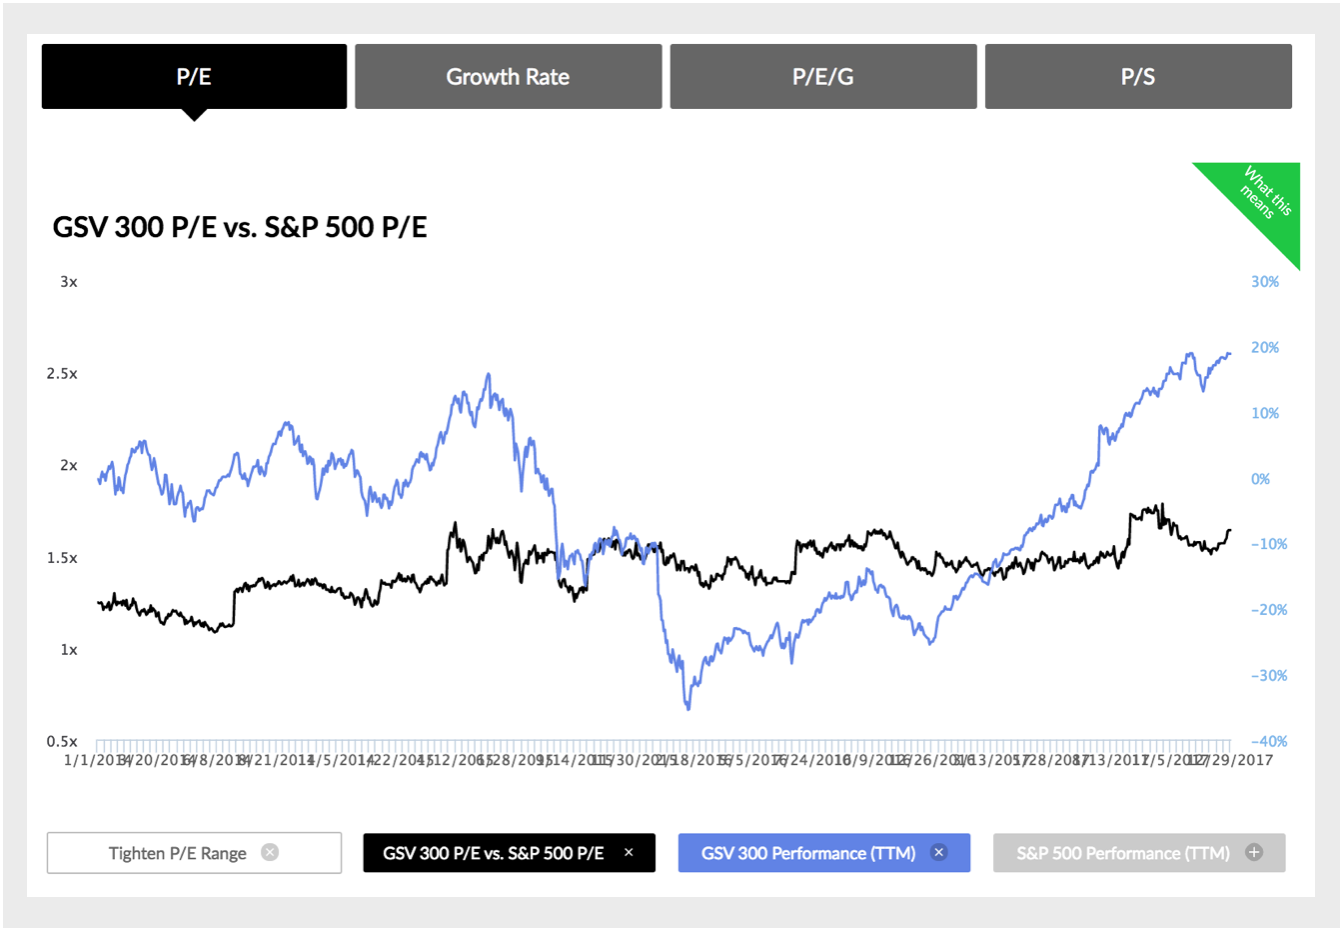
Since small companies are expected to grow at a faster rate than large companies, they usually sell at a higher P/E than larger companies. Logic might suggest, therefore, that the P/E of the New Horizons Fund would be higher than that of the S&P 500 at all times.
This isn’t always the case, and at times when it isn’t, the New Horizons Fund can be a smoke signal for an undervalued or overheated growth economy. Over the last 50 years, for example, the New Horizons P/E has risen to double that of the S&P 500 only four times.

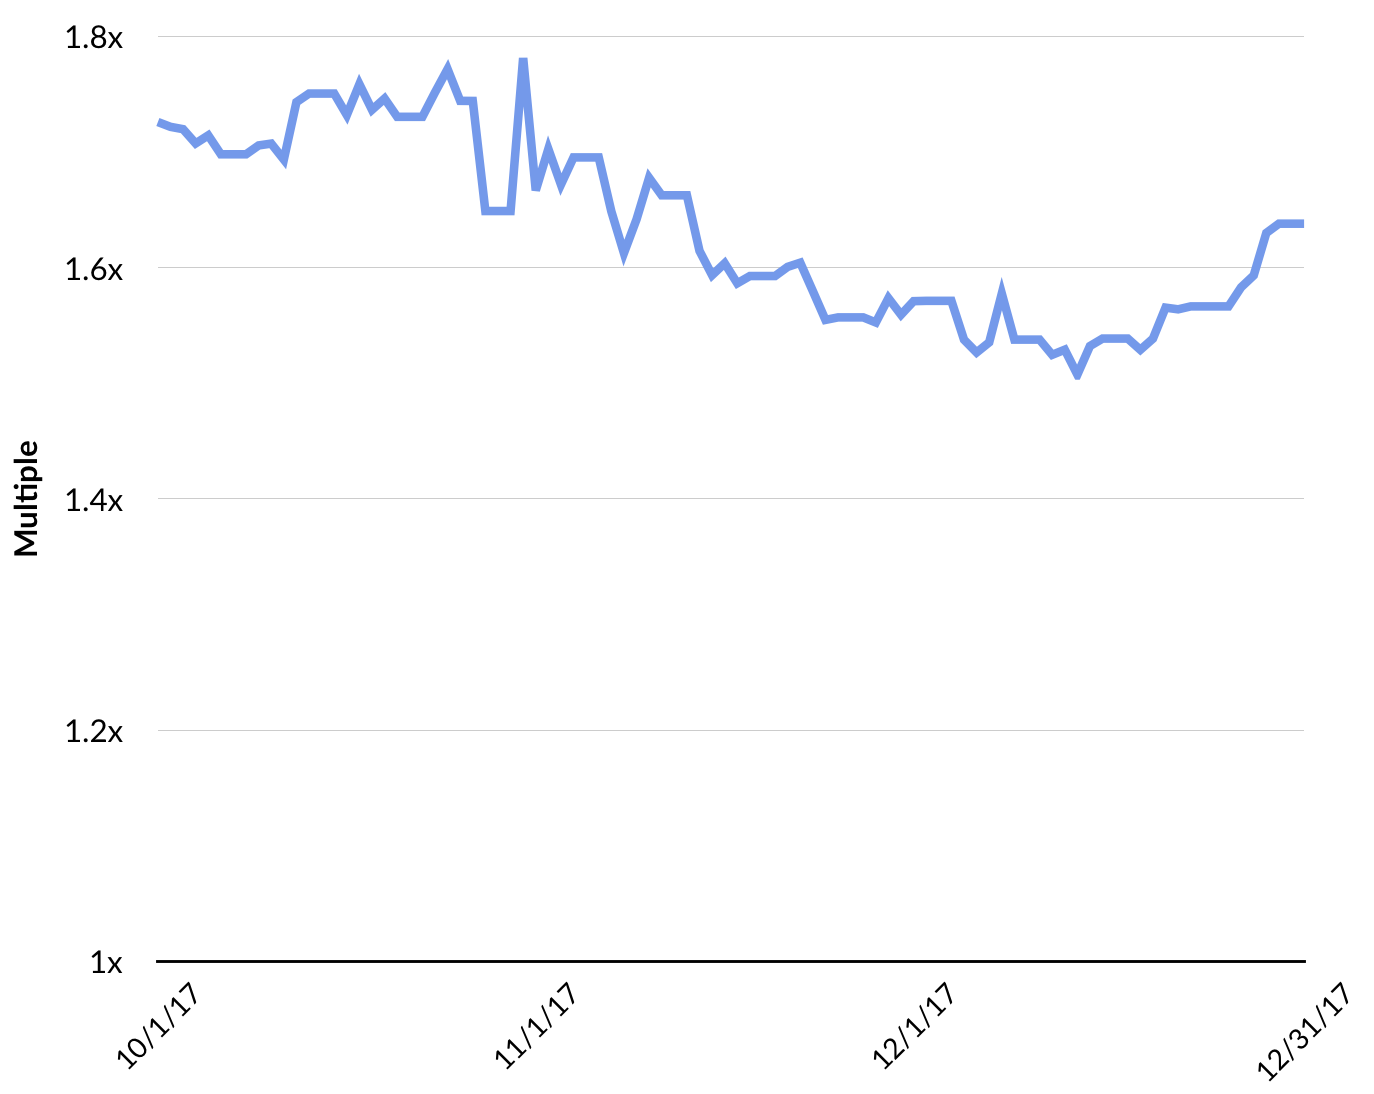
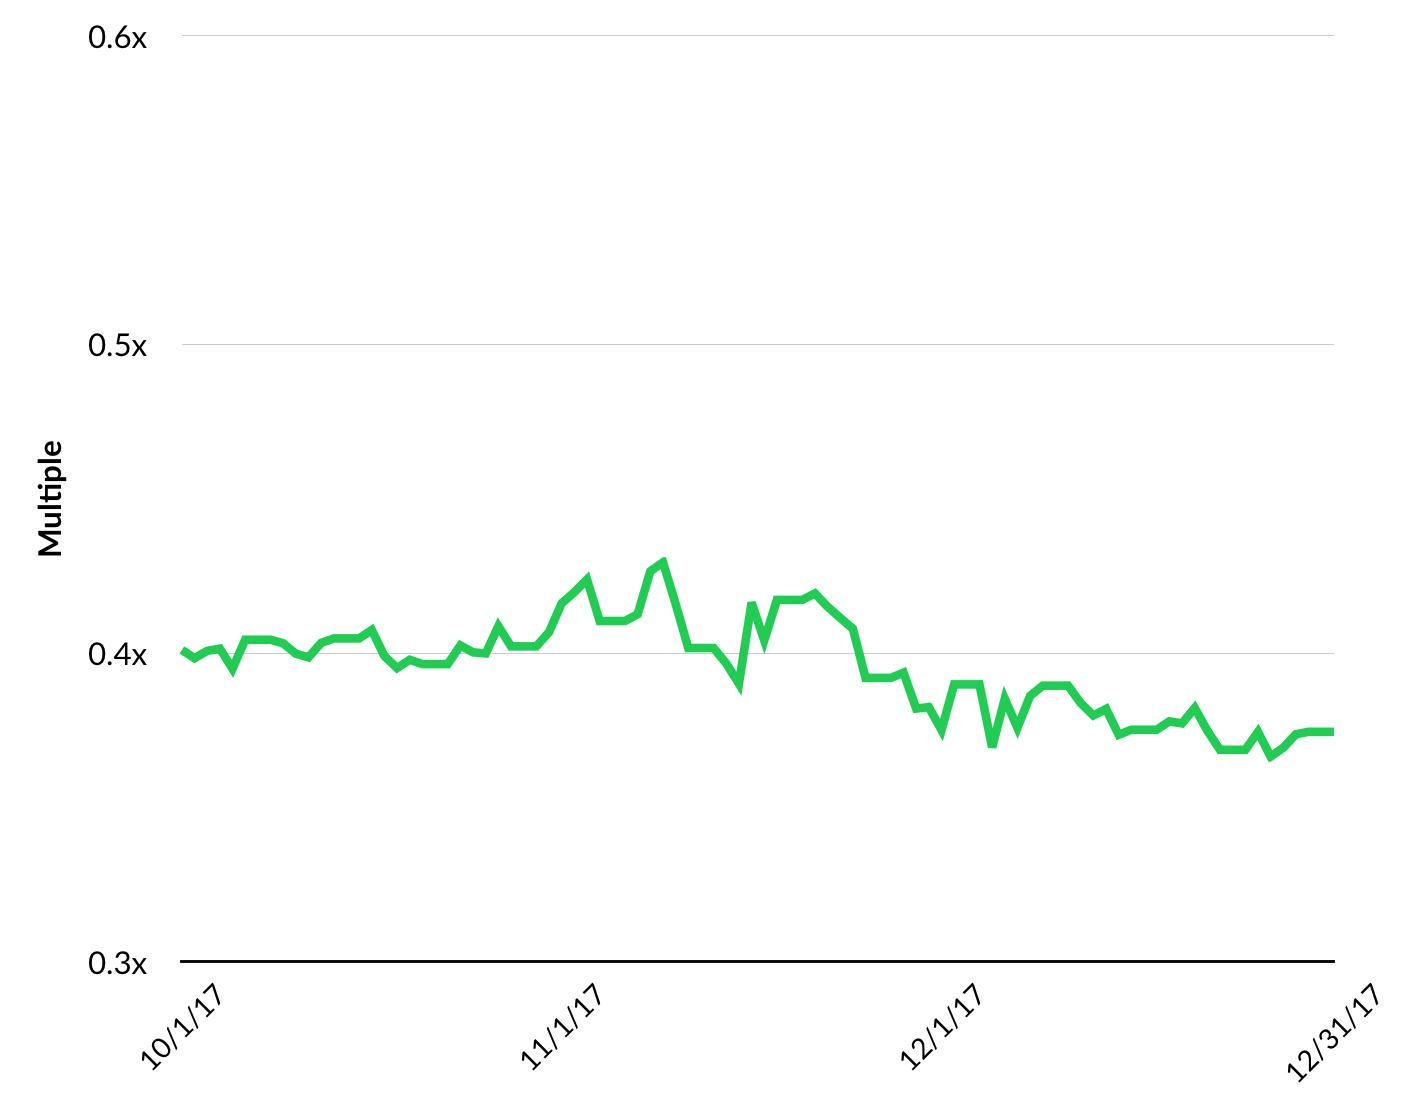
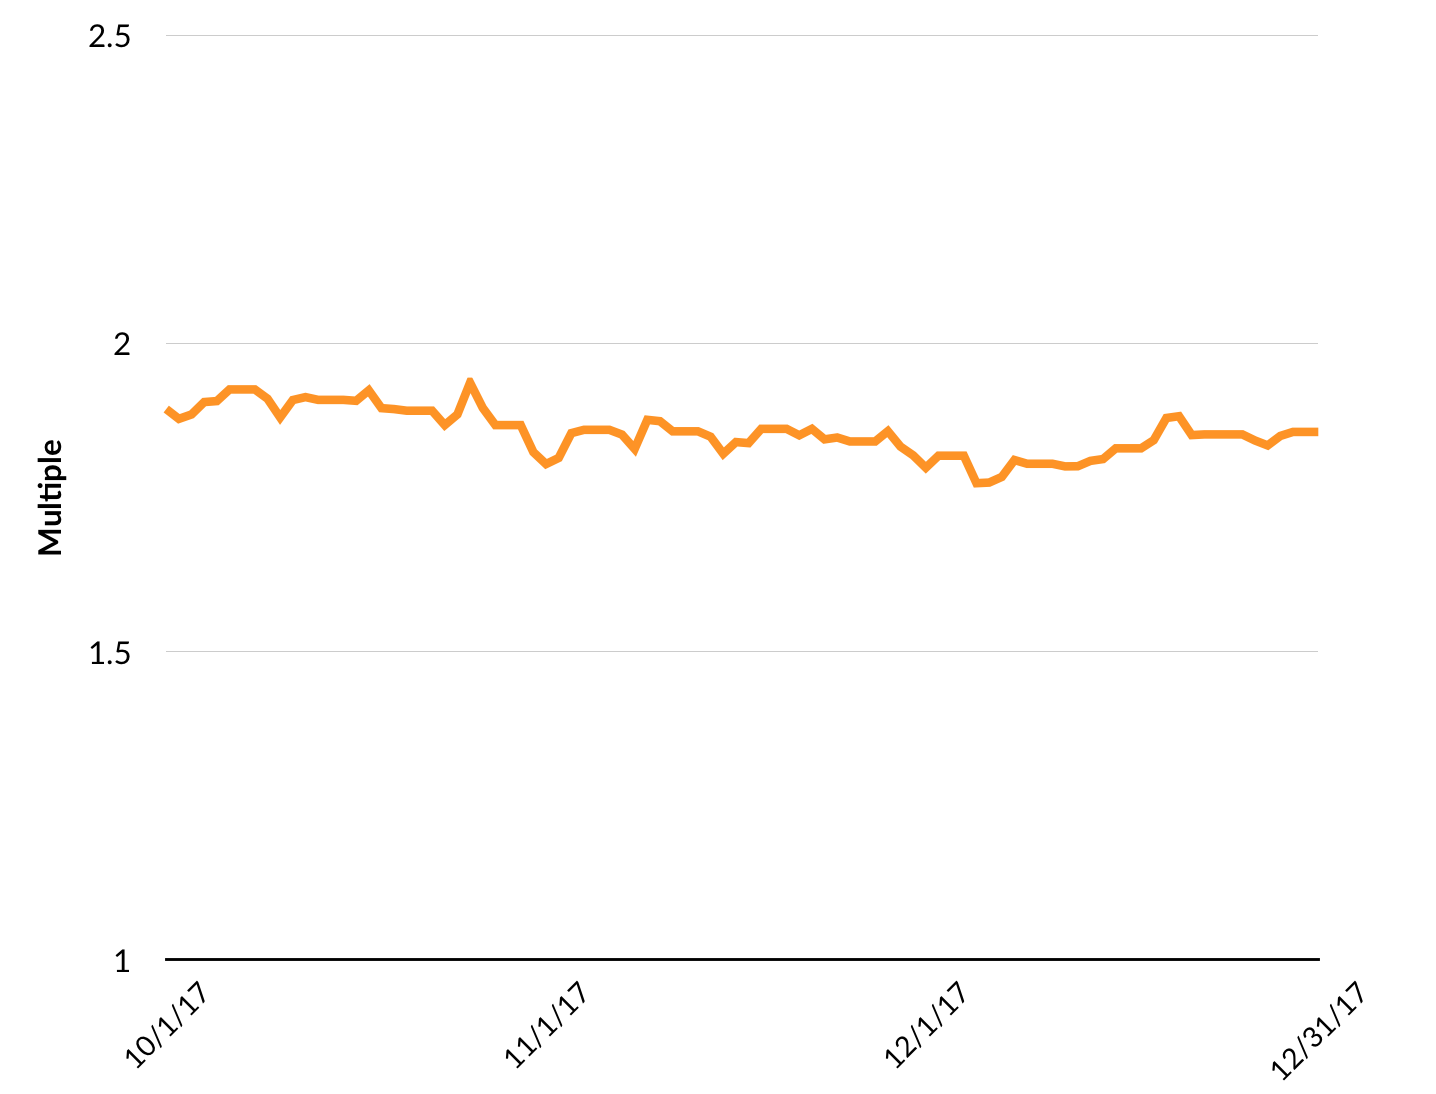
Currently, the GSV 300 has a P/E (forward) of 26.1, or 1.4x greater than the S&P 500. Our thesis is that at over 2x, it’s a warning signal for growth stocks, and at under 1.2x, it’s a buying opportunity. We’ll monitor this trend, as well as the relationships of other key valuation metrics, to determine patterns over time.
IPOs
The Stock Market reflects the confidence investors have in the future, and the IPO market is an even more acute indicator. If investors are pessimistic, new issues shut down. If investors are optimistic, they treat IPOs like fresh oxygen that they can’t get enough of.
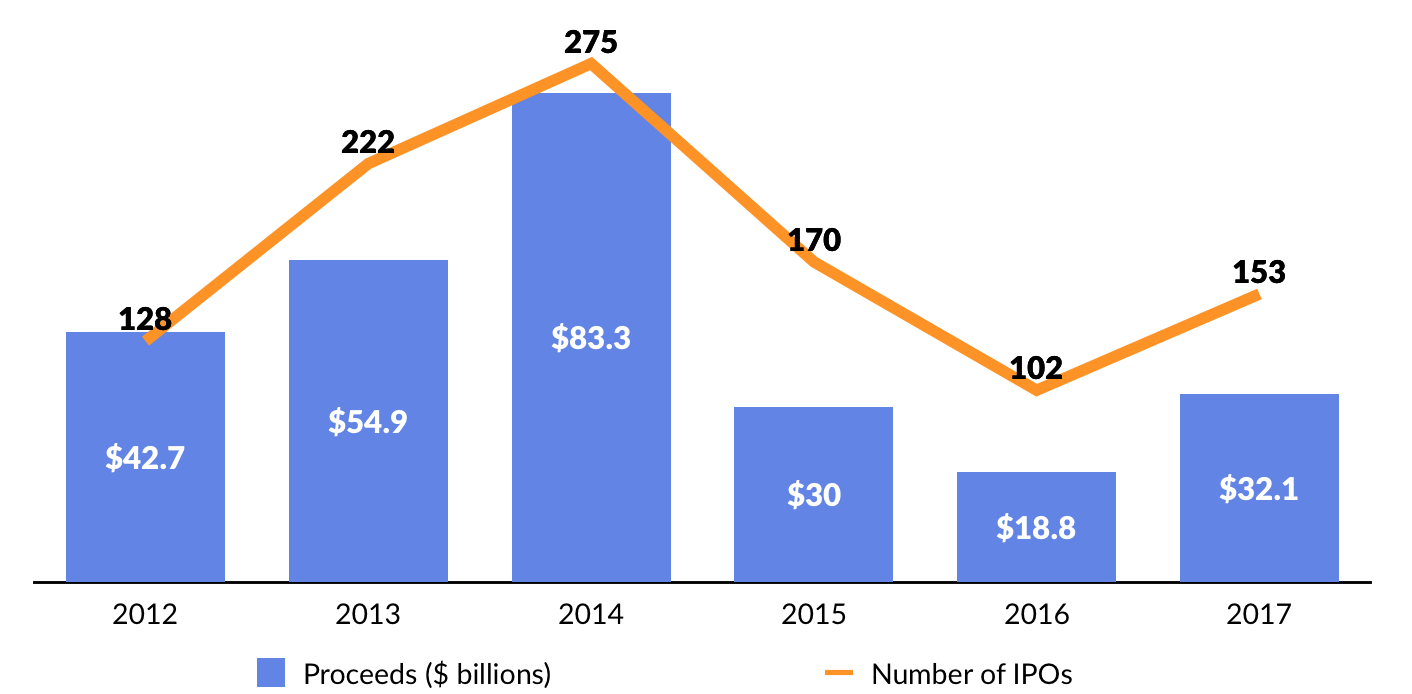
On a relative basis, the IPO market sprang to life in 2017, with 153 companies going public and raising a combined $32.1 billion in proceeds. Compare that to 2016, when only 102 companies listed and IPO proceeds were a paltry $18.8 billion. In the past 15 years, there has been an average of 108 IPOs annually, down from the decade of the 90s, which had an average of 406 IPOs annually.
In March 2017, Snap, the parent of Snapchat, raised $3.4 billion. It was the largest IPO of a U.S. company since Facebook, which raised $16 billion in 2012, and the largest overall since Alibaba, which raised $25 billion in 2014. Reportedly 10-times oversubscribed, it was greeted by eager investors, pricing above the range and popping 44%. Since its IPO, Snap’s market value has fallen to $17 billion as the company faces stiff competition from Facebook’s Instagram. In November, Tencent took a 12% stake in Snap.
IPOs coming out of the Middle Kingdom picked up in 2017, with 16 Chinese companies listing in the United States including Best Logistics, search engine Sogou, and China Literature. In 2018, we expect to see more blockbuster IPOs from China, including DiDi and Xiaomi.
Also of note, seven Chinese education companies went public abroad including: Wisdom Education International Holdings (Hong Kong), Yuhua Education Group (Hong Kong), Minsheng Education Group (Hong Kong), Bright Scholar (NYSE); RYB Education (NYSE), RISE Education (NYSE), and Four Seasons (NYSE).

While we were pleased to see improving IPO activity in 2017, the recent trend points to a broader opportunity for the best names to break through an IPO backlog that has been building over the last fifteen years.

Source: GSV Asset Management
Disclosure: GSV owns shares in Lyft
In 2016, Vice Media CEO Shane Smith indicated that he was in discussions with major banks about taking his $4 billion company public. That year, WeWork CEO Adam Neumann remarked in an interview that, “we’re not afraid to go public.” WeWork is now valued at $20 billion following a $4.4 billion financing led by SoftBank in August.
At the Wall Street Journal’s Global Technology Conference, Palantir CEO Alex Karp suggested that the company had prepared itself should it decide to go public in 2017 or 2018. Creating liquidity opportunities for employees was one of the motivations. (Disclosure: GSV owns shares in Palantir)
In February, Karp predicted that the company would be breakeven by the end of 2017, noting that Palantir’s cash burn rate has decreased by approximately 60% versus 2016. Palantir’s operations in the UK are profitable today, as European revenue has roughly tripled over the past three years.
IDC estimates that Palantir operates in a sector that will grow from $150 billion in 2017 to over $210 billion in 2020. The company’s applications range from cyber security to capital markets intelligence, healthcare delivery, and defense. Importantly, while Palantir launched with a focus on large government contracts, corporate customers now represent over half of its revenue. Key clients include Airbus, AXA, Merck, BP, Deutsche Bank, and GlaxoSmithKline.
While Uber and Lyft continue their rapid growth, China’s DiDi Chuxing may be an IPO candidate to watch in 2018 now that it has absorbed Uber China. At $56 billion, DiDi is the World’s most valuable private company and it now completes over 25 million rides per day with a network of 21 million drivers.
The list of IPO candidates goes on.
6410974881.png)
Disclosure: GSV owns shares in Dropbox, Lyft, Palantir, Spotify
*Spotify has indicated that it will pursue a direct listing, as opposed to a traditional IPO
In the first week of 2018, Spotify — the World leading music streaming platform which now counts well over 140 million users and 70 million paying subscribers across 60 international markets — filed to go public on the New York Stock Exchange in a direct listing. Unlike an IPO, a direct listing forgoes underwriters, lockups, and the typical infusion of capital associated with a traditional public offering. (Disclosure: GSV owns shares in Spotify)
To date, it has raised over $1.6 billion from a syndicate of investors including Accel Partners, Technology Crossover Ventures, and Goldman Sachs. Other IPO candidates such as Airbnb and Palantir, will be watching Spotify’s direct listing closely, as that might turn out to be a more attractive choice.
The company’s long-term growth has been driven by outstanding fundamentals. Spotify reports that since 2014, listening hours per user are up 25%, and the average number of artists each listener streams per week has increased 37% over the same period. In other words, not only are people spending more time on the platform, they’re engaging with a broader range of content. It’s a double play.
Just one week after Spotify filed, Dropbox confidentially filed to go public. One year ago, Dropbox became the fastest Software-as-a-Service business to reach the $1 billion revenue run-rate milestone, according to its CEO Drew Houston. It hit the mark in eight years, beating SaaS leaders like Salesforce and Workday. (Disclosure: GSV owns shares in Dropbox)
Impressively, Drew Houston announced in April that the company had become profitable on an EBITDA basis. This follows a June 2016 announcement that Dropbox had achieved positive free cash flow. Today, Dropbox likely counts over 600 million users and 300,000 business customers – including a majority of Fortune 500 companies. Rarely have we seen a business operate with this combination of growth, profitability, and scale.
