Growth, Innovation + Investing
from A Round to Apple Inc.

We’ve been delivering authoritative market analysis and perspectives, week-in and week-out for more than a decade. Sign up so we can update you with new releases of A2Apple and our other daily and weekly publications — sent straight to your email.

And make sure to keep a close eye on our research and commentary arm, GSV Tomorrow, where you’ll find original GSV insights, plus curated content revolving around our key Growth Themes. Just complete this form and they’re yours to use and share.

GSV's weekly perspective on Growth, Innovation + Investing...
from A Round to Apple Inc.
General Commentary
July 9, 2017

Go For the Growth

Save to PDF

Market Snapshot

Indices Week YTD

This week leaders of the G-20 nations met in Hamburg, Germany, but if you read the headlines, you might have mistaken the summit for a primetime prizefight between President Trump and Vladimir Putin. The much-hyped meeting obscured an agenda focused on global economic growth.

When it comes to one key indicator of economic growth — stock market performance — Russia actually offers an useful lens to view the global state of play. Equities in Russia have tumbled in 2017 — the flagship RTSI index was down nearly 16% at the end of the second quarter — while stock markets in almost every other G-20 nation have risen, and in many cases surged.

As of June 30, the S&P 500 was up 8.2%, NASDAQ had risen 14.1%, and the Dow had gained 8.0%. China’s SSE Composite Index was up 2.9%, Hong Kong’s Heng Seng has jumped 17.1%, and India’s Sensex was up 16.1%. As what might be a preview to future opportunities, the GSV 300, which is made up of 300 of the fastest growing companies in the World was up a whopping 26.6% in the first half.

WORLD INDICES

Source: Yahoo Finance, GSViQ

The most relevant index for Institutional Investors to date has been the S&P 500, which is a good proxy for broad Market dynamics. But with a 7% long term growth rate, it hardly reflects conditions or performance for fast growing companies.

The fact that the S&P 500 is solely a market cap weighted index is problematic in that a $100 Billion Market Cap Company has 100x the impact on the Index as a $1 Billion Market Cap Company… not realistic in that a portfolio manager who viewed two portfolio companies as being equally attractive would have 100x more of that company in their portfolio.

The most well-known index, the Dow Jones Industrial Average (DJIA), is created with an even more bizarre rationale in that it is weighted by share price. So in other words, if one stock was $30 per share and another was $300 per share, the $300 stock would have 10x the influence on the DJIA as the $30 stock.

THE GSV 300 GLOBAL GROWTH INDEX
The Definitive Barometer for the Global Growth Company Ecosystem

Source: GSV Asset Management

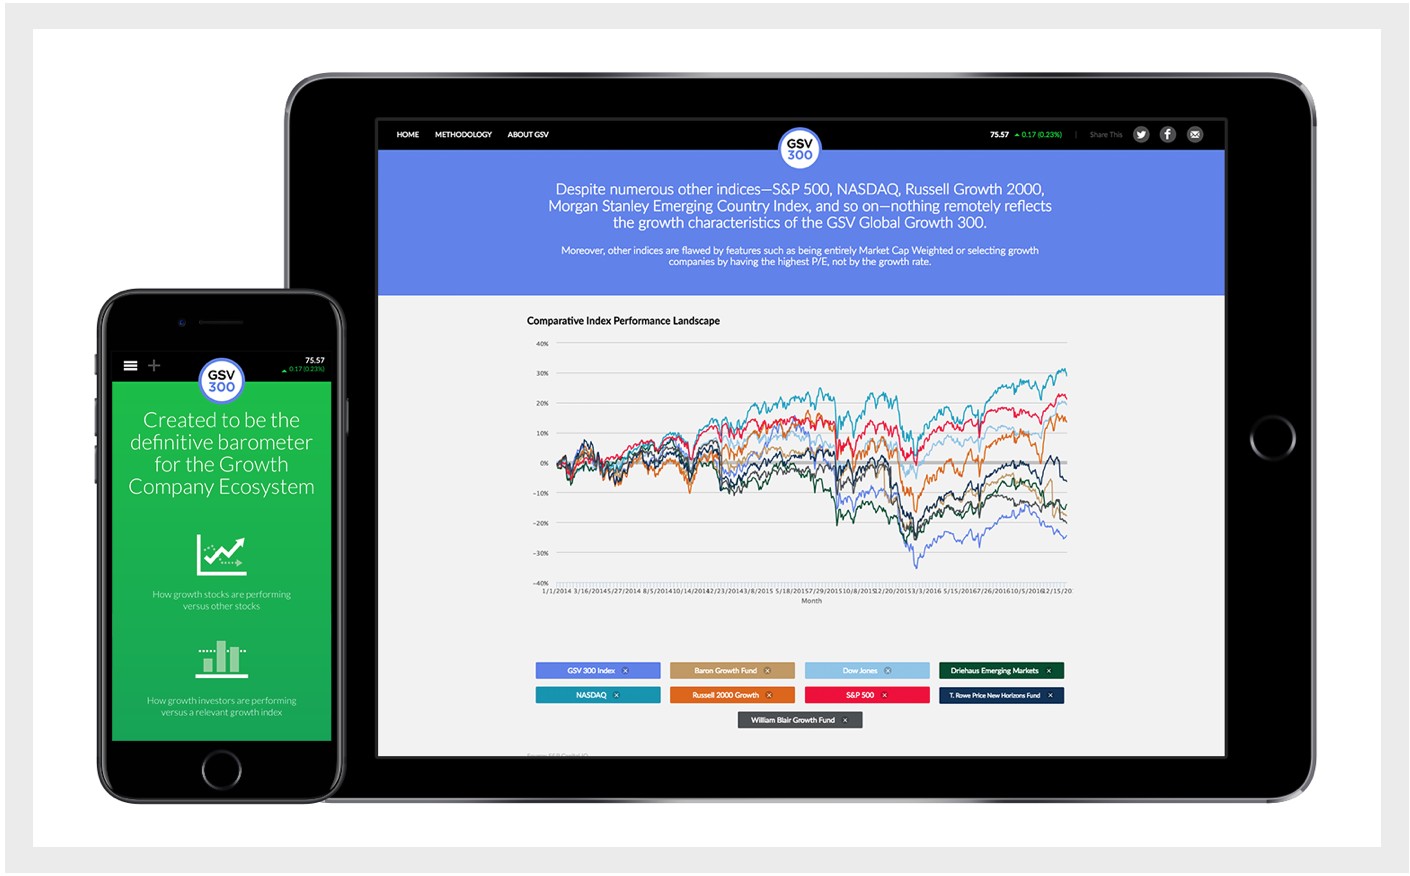
In 2015, GSV launched the GSV 300 Index, which we believe is the best representation of what is truly going on with growth companies, their valuations, and performance. It is an index of 300 of the World’s fastest growing companies, selected systematically based on key fundamentals, including revenue and earnings growth, geography, valuation metrics, and market capitalization.

The GSV 300, by contrast, is constructed using a systematic three-step process, which is summarized below: Screening, Ranking + Scoring, and Index Weightage. For a full description of the GSV 300 construction methodology, please click HERE.

GSV 300 METHODOLOGY SUMMARY

The average market capitalization of GSV 300 constituent companies is $7.0 billion, with a median of $1.6 billion. The 10 largest companies account for 25% of the index. By comparison, the top five companies in the 2,500-company NASDAQ Composite — Apple, Microsoft, Amazon, Facebook, and Alphabet (Google) — account for over 30% of the index alone.

GSV 300 SNAPSHOT

Source: GSViQ

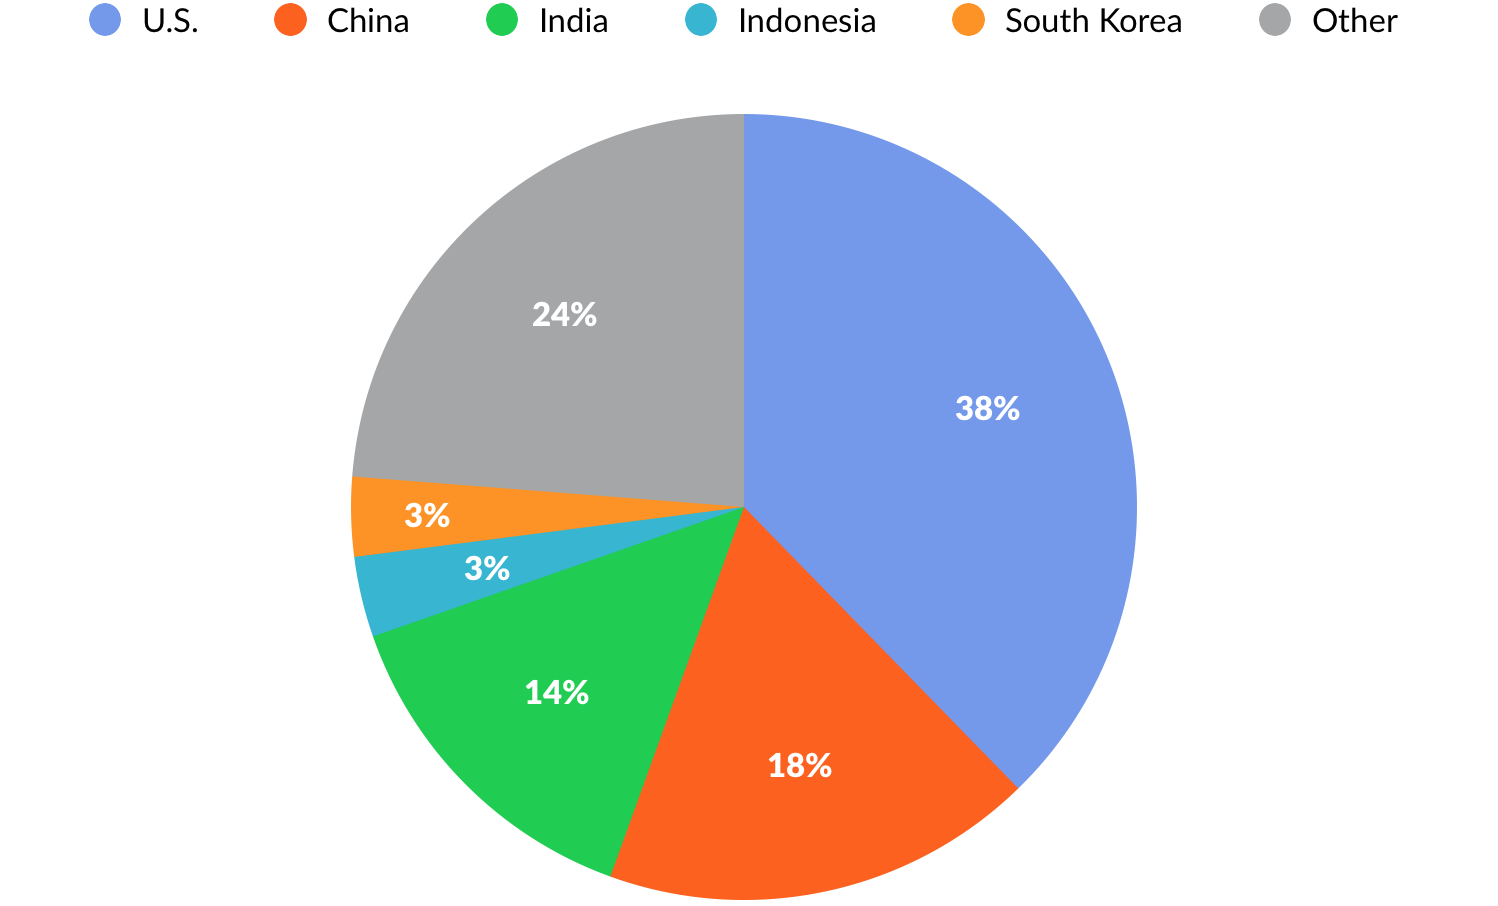
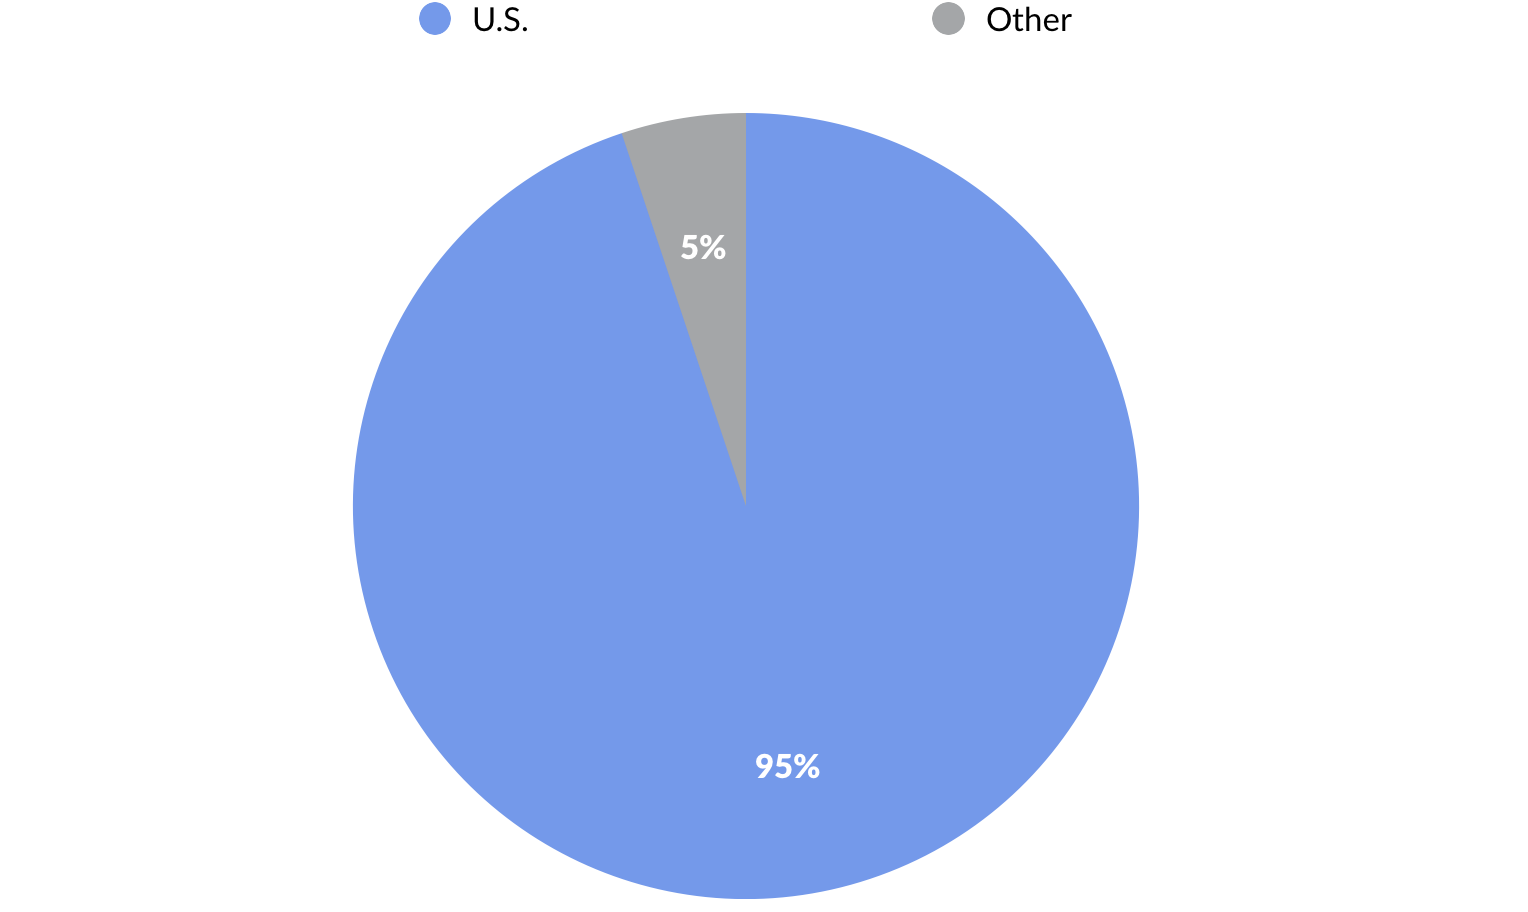
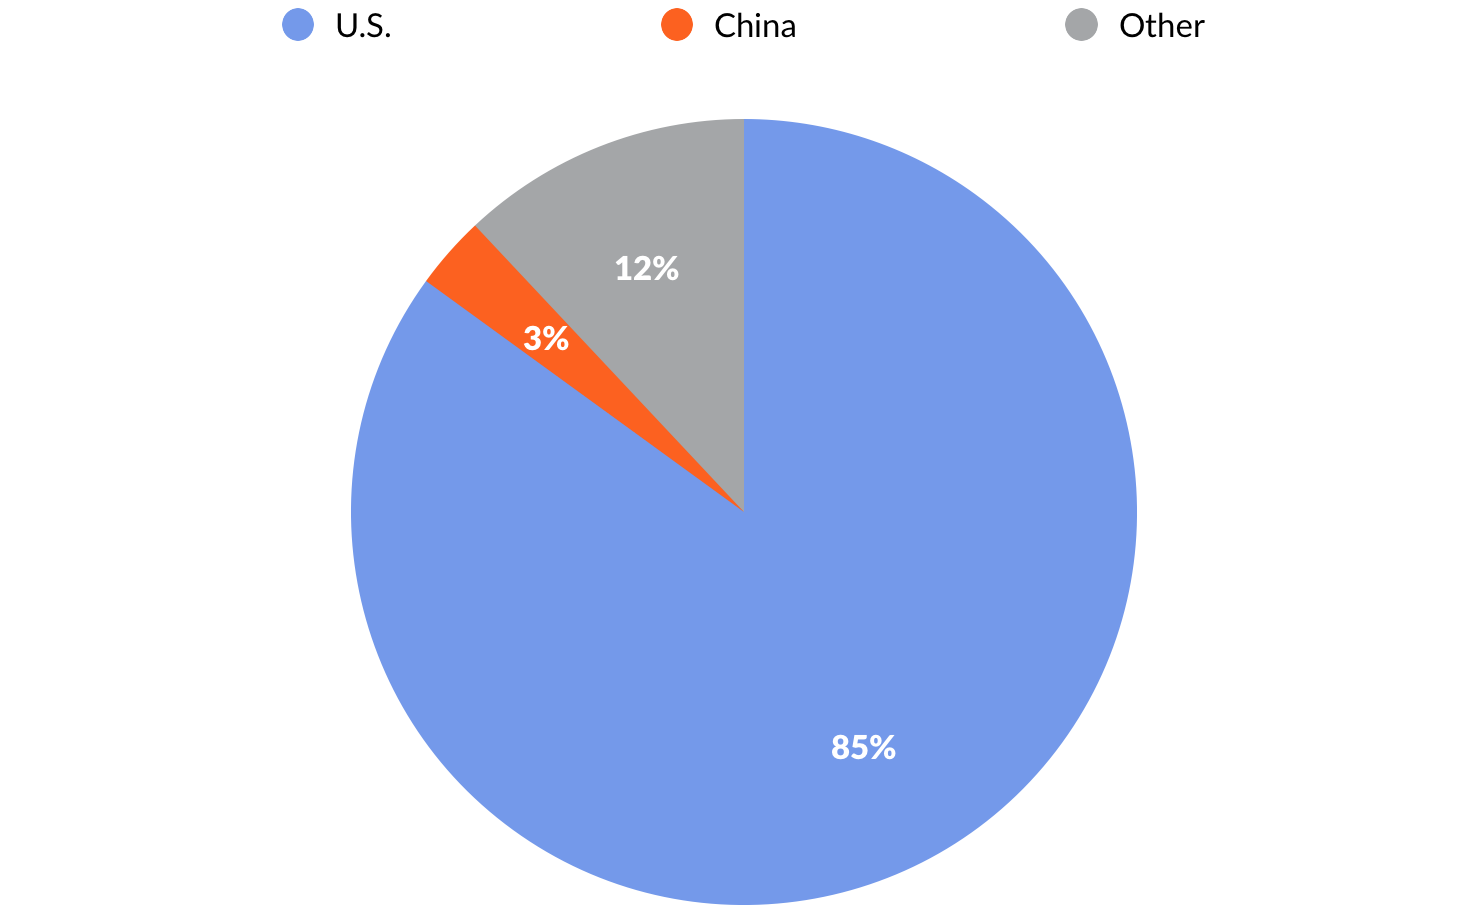
Looking at the GSV 300 by geography, 38% of the index weightage comes from U.S. companies. China is the second-largest geography at 18%, followed by India at 14%, and Indonesia and South Korea at 3%. By contrast, 95% of the S&P 500 and 85% of NASDAQ are represented by U.S. companies.

GSV 300 BREAKDOWN BY COUNTRY
Countries of GSV 300 Constituent Companies as a Percentage of Index Weightage

Source: GSViQ
S&P 500 BREAKDOWN BY COUNTRY
Countries of S&P 500 Constituent Companies as a Percentage of Index Weightage

Source: GSViQ

NASDAQ BREAKDOWN BY COUNTRY

Countries of NASDAQ Constituent Companies as a Percentage of Index Weightage

Source: GSViQ

GSV 300 UPDATE: Q2 2017

The GSV 300 has roared up 26.6% year-to-date, gaining 8.5% in the second quarter. While we were pleased with the strong performance, our objective in launching the index was to create a scorecard that reflects what is actually going on in the World of growth stocks. The real insight is in the metrics.

Segmented by country, second quarter growth was led by Chinese companies, which gained 9%. Indian and U.S. companies rose 8% and 7%, respectively.

GSV 300 PERFORMANCE BY COUNTRY
Q2 2017 Performance of the GSV 300 by Country of Constituent Companies

Source: Yahoo Finance, GSViQ

Segmented by GSV investment theme, “Marketplace” enterprises recorded the highest gains, rising 25% for the quarter. “Social/Mobile” companies were up 13%, “Cloud + Big Data” companies were up 9%, and “Sustainability” and “Education Technology” companies were up 8% and 7%, respectively.

GSV 300 PERFORMANCE BY GSV INVESTMENT THEME
Q2 2017 Performance of the GSV 300 by Industry of Constituent Companies

Source: Yahoo Finance, GSViQ

We will continue to root for strong performance. But our goal with each passing quarter is to develop a data set that becomes a barometer for growth, especially when comparing the fundamentals of the GSV 300 to traditional indices.

The T. Rowe Price New Horizons Fund, for example, has pursued a strategy of investing in small, high-growth companies since 1961. While it is actively managed, Peter Lynch observed in Beating the Street that the fund is, “as close as you’ll get to a barometer of what is happening to emerging growth stocks.”

Since small companies are expected to grow at a faster rate than large companies, they usually sell at a higher P/E than larger companies. Logic might suggest, therefore, that the P/E of the New Horizons Fund would be higher than that of the S&P 500 at all times.

This isn’t always the case, and at times when it isn’t, the New Horizons Fund can be a smoke signal for an undervalued or overheated growth economy. Over the last 50 years, for example, the New Horizons P/E has risen to double that of the S&P 500 only four times.

GSV 300 VALUATION METRICS
GSV 300 Valuation Metrics vs. Key Indices (As of June 30, 2017)

Source: Capital IQ, GSViQ

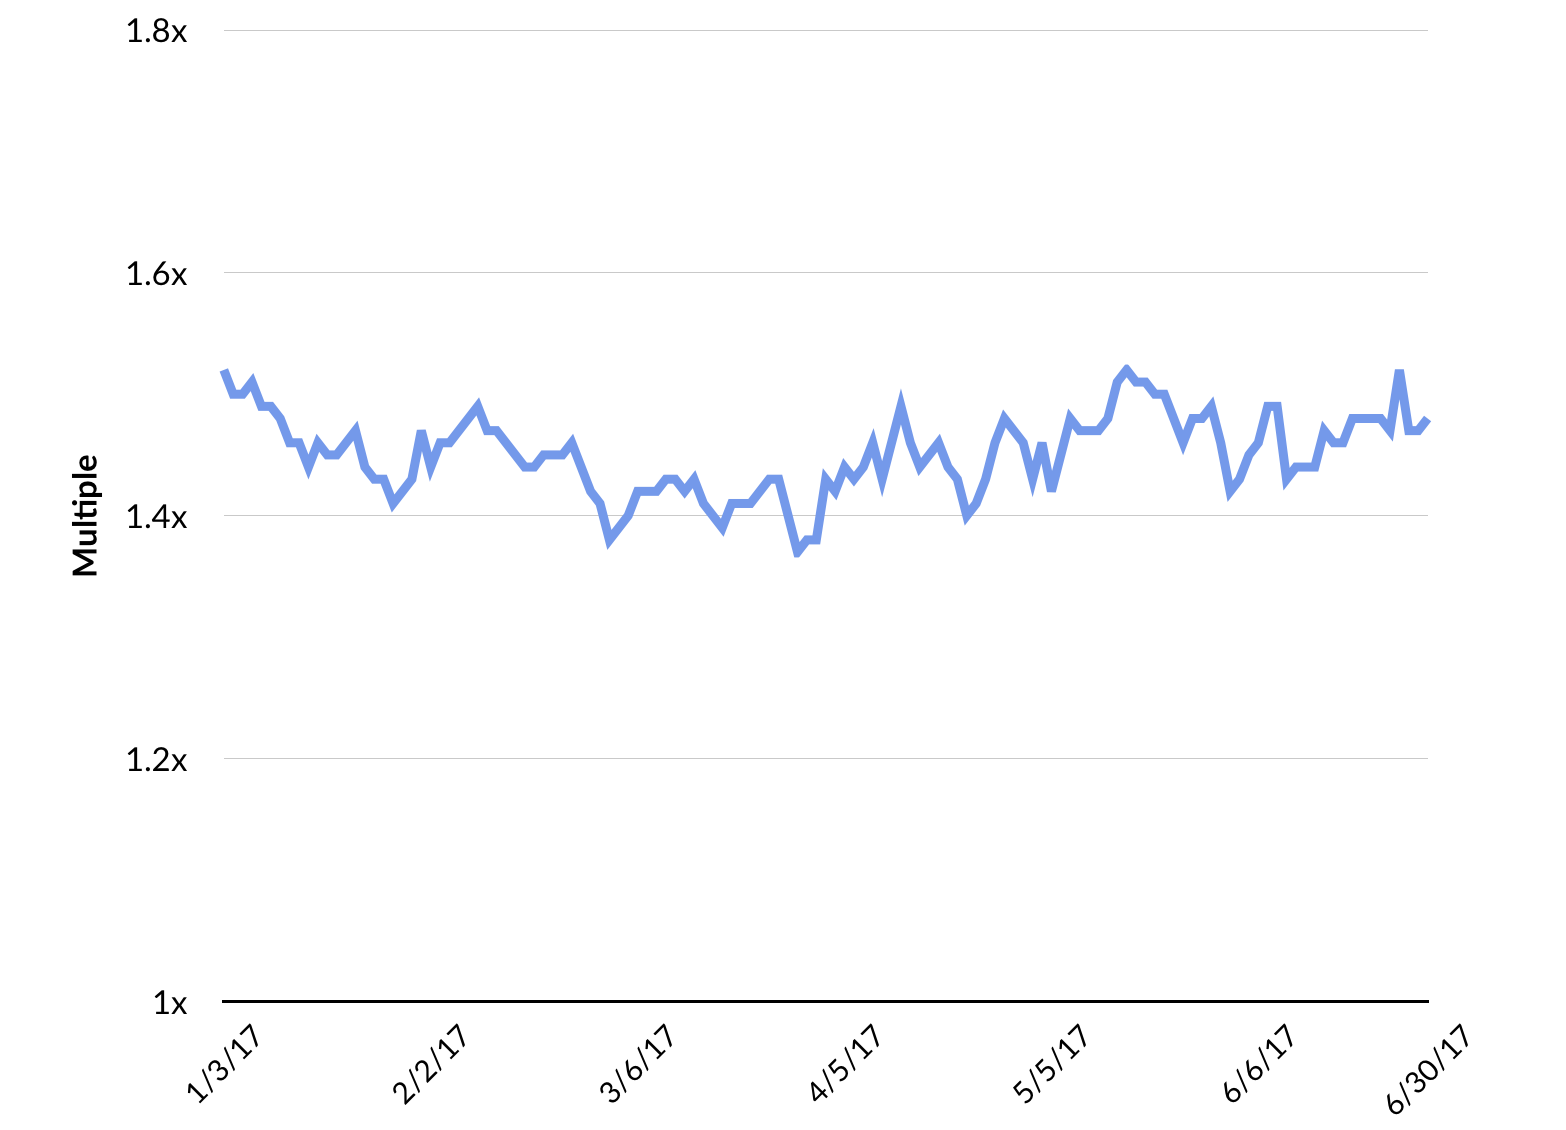
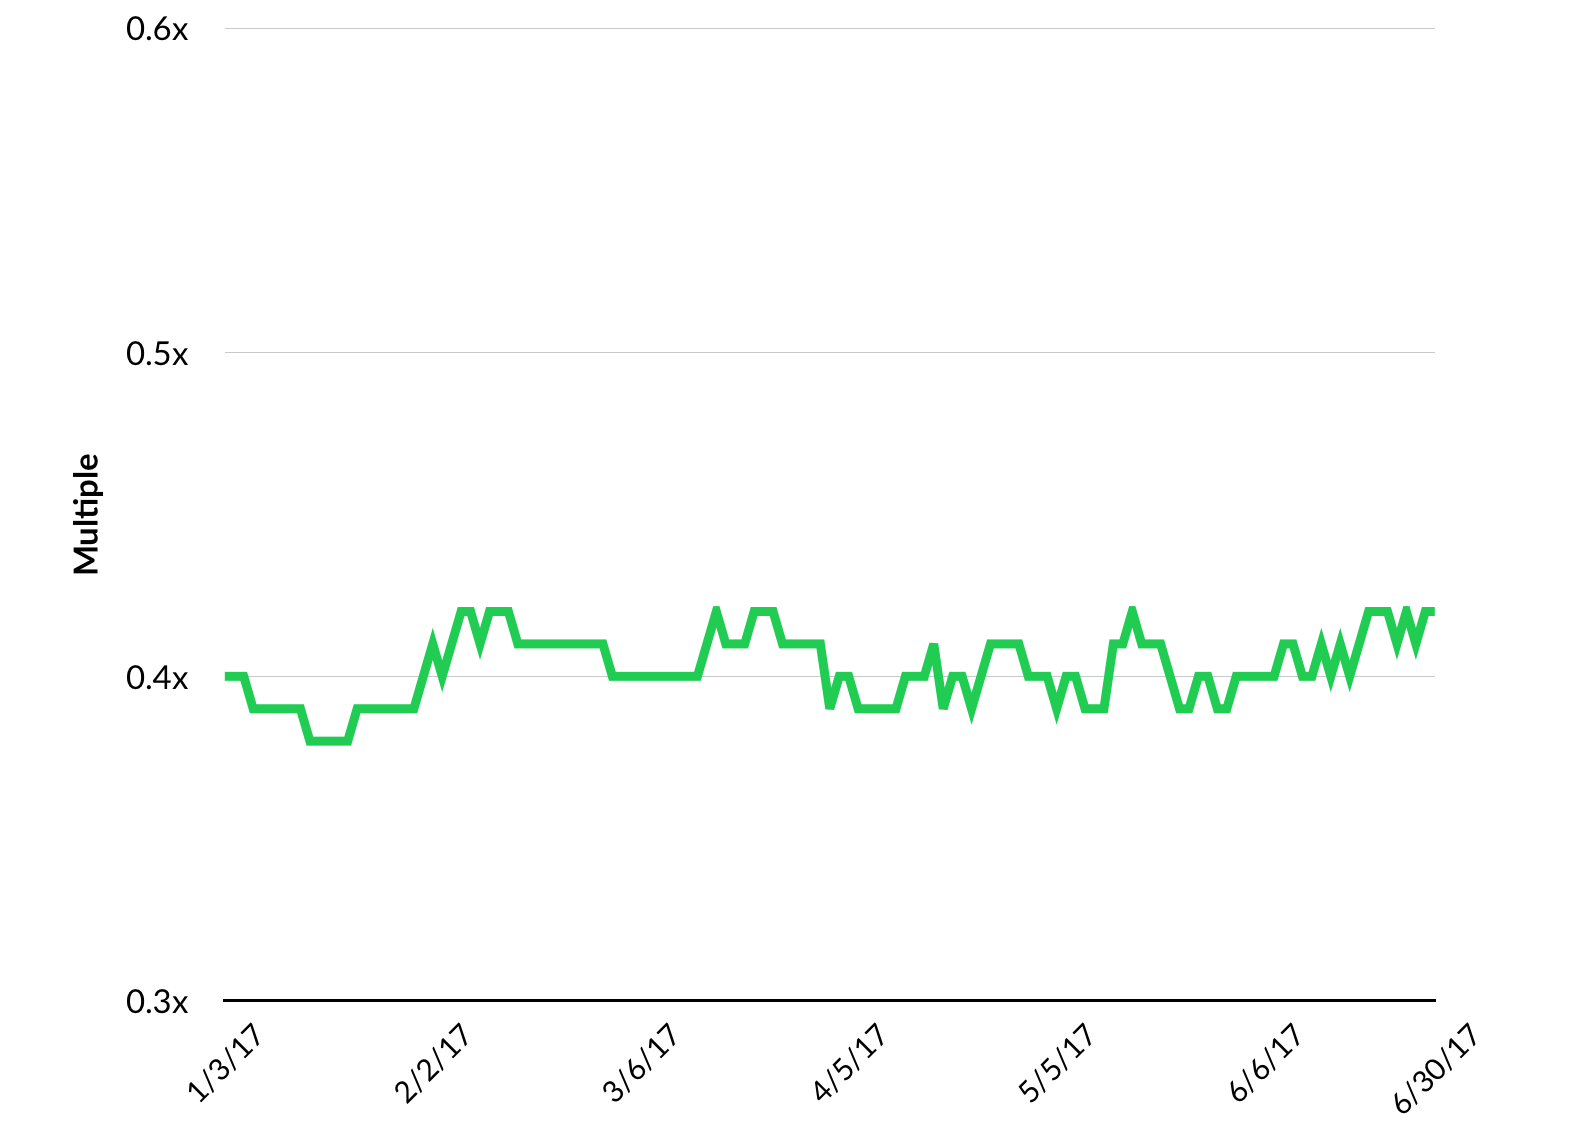
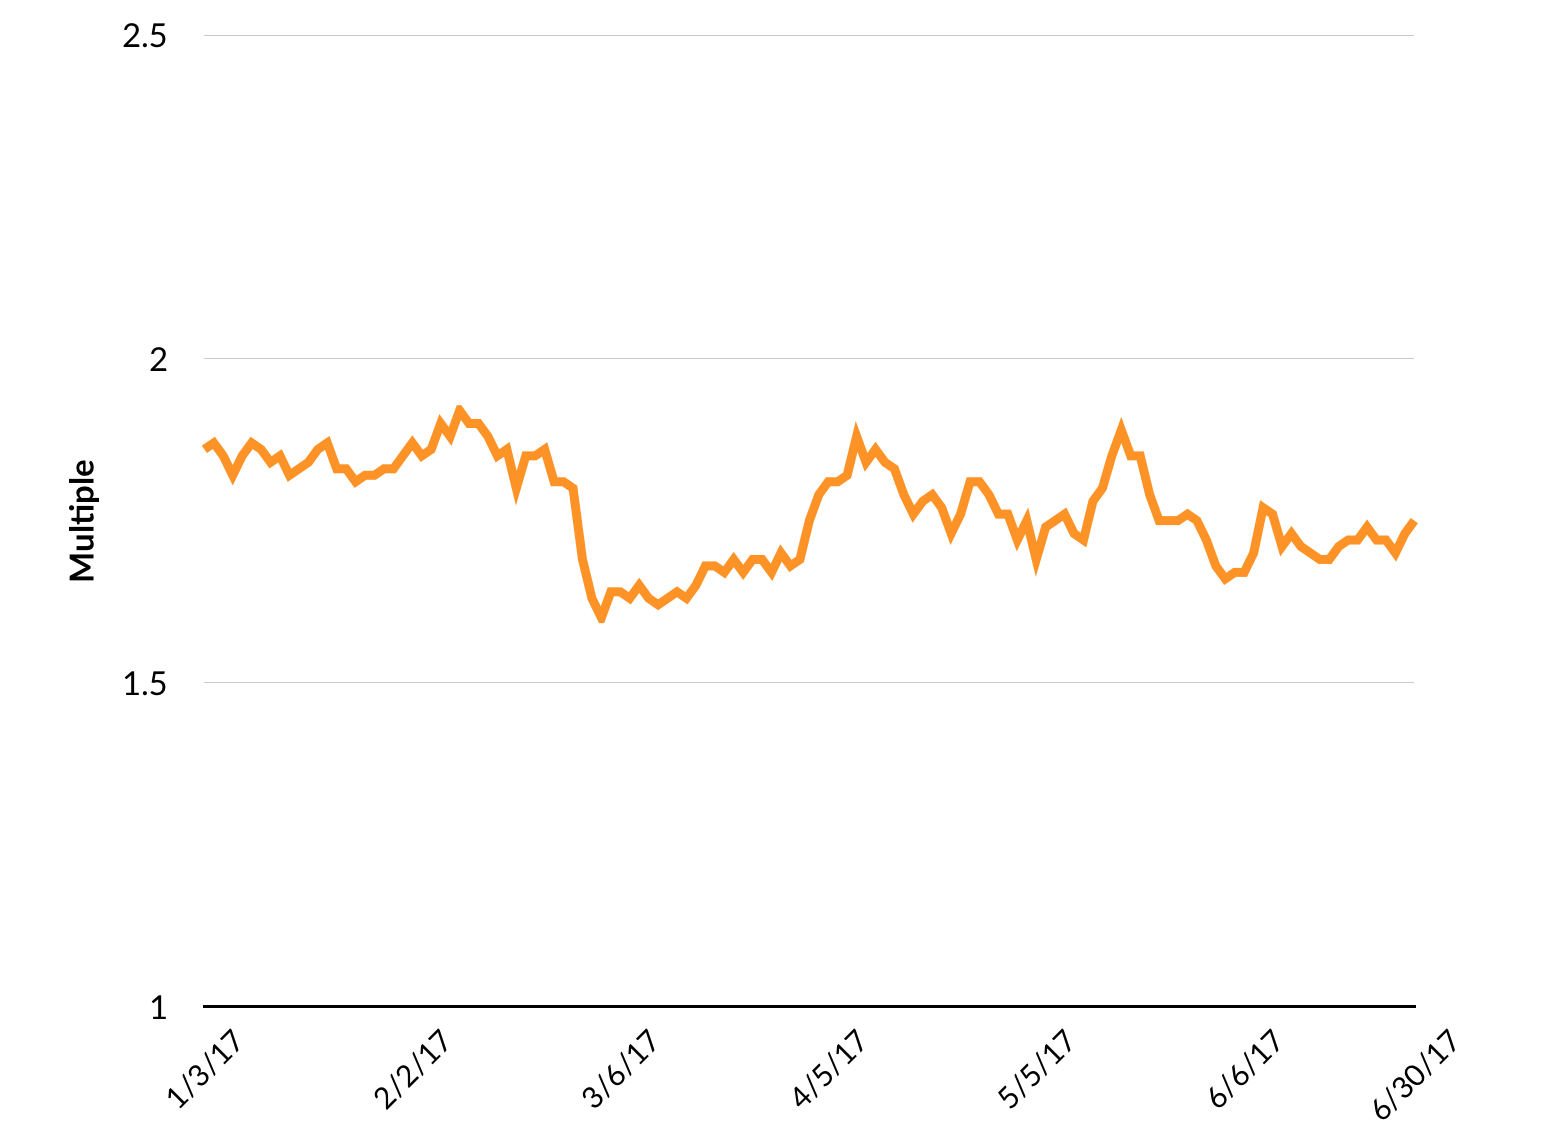
Currently, the GSV 300 has a P/E (forward) of 26.9, or 1.5x greater than the S&P 500. Our thesis is that at over 2x, it’s a warning signal for growth stocks, and at under 1.2x, it’s a buying opportunity. We will continue to monitor this trend, as well as the relationships of other key valuation metrics, to determine patterns over time.

GSV 300 P/E VS. S&P 500
GSV 300 P/E as a Multiple of the S&P 500, through Q2 2017

Source: GSViQ, Capital IQ
GSV 300 P/E/G VS. S&P 500
GSV 300 P/E/G as a Multiple of the S&P 500, through Q2 2017

Source: GSViQ, Capital IQ
GSV 300 P/s VS. S&P 500
GSV 300 P/S as a Multiple of the S&P 500, through Q2 2017

Source: GSViQ, Capital IQ

IPO UPDATE: Q2 2017

Through the end of Q2, there were 72 IPOs — 28 VC-backed — generating an average of $245 million in proceeds. Twelve companies priced above range, 40 priced in range, and 20 priced below. The average one-day pop was 8%.

Q2 2017 IPO SNAPSHOT

Source: GSViQ

April had two notable technology IPOs with both Okta and Yext going public, popping 38% and 22% respectively. Founded in 2009, enterprise cloud security startup Okta had VC backers including Andreessen Horowitz, Sequoia Capital, and Greylock. Yext lets businesses like BMO Harris Bank, Marriott, and Ben and Jerry’s manage their digital knowledge in the cloud and syncs it to over 100 services, including Apple Maps, Google, Instagram, Siri and Yelp.

Recipe and food delivery service Blue Apron went public late last week, pricing at the low end of its offering and trading flat. The company slashed its IPO offering price from $15-17 to $10 following the announcement of the Whole Foods and Amazon acquisition. The company has delivered over 159 million meals and recipes to date and its investors included Bessemer, First Round, and Fidelity. Blue Apron has fallen going public, down nearly 20% since last week.

Also going public late last week, food delivery service Delivery Hero made its debut on the Frankfurt Stock Exchange, popping 11%. Backed by Rocket Internet, Delivery Hero is available across 42 countries and counts 150,000 restaurants as partners in its network. Delivery Hero’s investors alongside Rocket Internet included Insight Venture Partners, Naspers and Holtzbrink.

NEW IPO FUNDAMENTALS

Source: GSV Asset Management
Disclosure: GSV owns shares in Lyft

Real estate startup Redfin filed for an $100 million IPO with Goldman Sachs as their lead banker. Based in Seattle and founded in 2004, Redfin has raised $186 million to date from investors including Madrona, DFJ, T. Rowe Price, and Wellington. Redfin was last valued at $500 million in 2015.

Bubblin'

by Luben Pampoulov

Mind the Gap

In social media, a company’s success and value are driven by its quality and size. The best indicator for quality is engagement — time spent per user per day, and the conversion ratio of active users compared to the total user-base. For most social media companies, the best ratio to use is the DAU-to-MAU ratio (daily to monthly active users). If the ratio is high, it means most users keep on using the network again and again…and they have very little churn.

When it comes to size, it obviously goes “the bigger the better.” But when doing an analysis, one has to be careful to not compare total users with monthly active users or with daily active users. The three metrics are all very different, and it is crucial to understand each of them separately and their ratio against each other.

Source: kernelmag.dailydot.com

Consider the following three cases:

Twitter was one of the hottest IPOs in 2013. The stock came out soaring, up 170% two months after its IPO, hitting a high of $70+ per share. At that point, Twitter had 232 million MAUs, growing at +48%, and 100 million DAUs. The 43% DAU/MAU ratio was signaling issues. Also, what the company was not disclosing was the time spent per user.

While Twitter was and continues to be a unique platform for sharing statements publicly, it failed to go beyond that. It is still the best to express yourself to the World, but it is not a good place to share pictures, videos or to read quality content. Hence, the time spent per user was always lagging at below 10 minutes per day. Compare that with Snapchat’s and Facebook’s 30+ minutes per day… (Disclosure: GSV owns shares in Snap)

Also, Twitter’s DAU/MAU ratio further decreased over the years, dropping to an estimated 30-35%. This implies Twitter’s most important audience is less than that of Snapchat, even tough its broader audience (MAUs) is significantly higher. Snapchat, with its highly engaging platform, has a much superior DAU/MAU ratio at above 60%.

Case #2 — for the last two years, SoundCloud has touted itself for having 175 million users, implying it is significantly bigger than rivals Spotify or Pandora, which have 140 million and 77 million users, respectively. However, SoundCloud never specified whether those 175 million users were the total user-base, or its active users. Turns out it has a much smaller number of monthly active users, at just about 45 million. This is a huge disconnect, and implies an enormous amount of churning users. At that level, SoundCloud is not bigger than Spotify, but rather three times smaller. (Disclosure: GSV owns shares in Spotify).

It’s not a surprise that SoundCloud is struggling to find a new investors and had to cut 40% of its workforce and closed two offices last week. Spotify meanwhile continues to thrive, with 50+ million paid subscribers. Spotify has consistently increased its paid user conversion, going from about 25% in 2015 to over 35% this year.

Third case — Slack’s $5 billion valuation might seem crazy if valuing it on the 5M DAUs it reported in January. It implies a $1,000 value per paid user. Meanwhile, LinkedIn with 109 million active users sold to Microsoft for $26 billion last year, implying a $240 value per user.

But Slack’s DAU/MAU conversion is around 80% (assumption is based on our research), implying its MAUs are approximately 6.3M. Accordingly, the value per MAU then is $800.

While still much higher compared to LinkedIn’s value per user, one has to account for the much higher paid user conversion rate, at around 30%. LinkedIn’s paid user base is less than 10% of its monthly active users. Also, Slack users spend significantly more time per day, which is estimated at over 100 minutes per day!

Lastly, Slack’s growth rate is still in the triple digits, implying strong business growth for the years to come. LinkedIn’s monthly active user base was growing at a mere 9% when it was acquired, reflective of it being a mature stage company.

In summary, when trying to value a social media company, it is crucial to understand the underpaying core drivers of the business. Those include time spent per day, conversion rates, and engagement. And always mind when there is a gap — the bigger the gap, the better it might be to short.

Pioneer Notes

by Li Jiang

The Only Way A US Tech Company Can Win in China

American tech startups and even more established companies competing to become a category leader in China is like European military powers trying to invade Russia during the winter.

It doesn’t work.

Google was slow to realize the rising competitive power of local grown Baidu. Facebook got censored and then largely displaced by Tencent’s WeChat. Uber ultimately bowing out by selling its China unit to Didi. Apple is besieged daily by new Chinese phone makers often with faster specs, and definitely at lower prices (more on Apple later).

Bless Mark Zuckerberg’s heart and his Mandarin skills but it’s going to be very difficult for Facebook to compete in China against Tencent.

The three factors that’s most difficult for U.S. (or really any non-Chinese) company to overcome is different consumer preferences, unfair government intervention, and the aggressiveness in which local competitors work.

Most company’s China strategy should and will end up in something other than growing organically. They can buy as Amazon did when it acquired Joyo for $75M in 2004. Joyo, now Amazon China, generated a reported $3B of revenue in 2016. Or invest as Apple did in Didi. Or create a joint-venture or franchise.

But the only way for a non-Chinese company to win organically in China is to build a BRAND. And not only any brand but one that is ASPIRATIONAL.

The Chinese consumer class is a new one, having made much of its purchasing power in the last two decades. In a mature market, people’s mentality is to buy the best product at the most affordable price. The Chinese psych is to buy products that reflect the aspirational lifestyle they want to have and will make the budget work.

Consumer models such as Louis Vuitton, Starbucks, KFC have seen success in China. In fact KFC is the largest restaurant chain in China with over 5,000 stores.

Tech models like Apple and Tesla also tap into the aspirations of Chinese consumers. Apple, while trying to fend off every form of competition, is still well positioned and beloved by Chinese consumers for its premium brand. It’s early lead may slowly get eroded by every other handset maker, but its brand and image remain an alluring moat for the company.

Apple store in Chongqing, my mom’s hometown.

Airbnb, which started life as a simple couch-surfing service, has created a lifestyle brand. Now it’s opening a separate China unit. Airbnb will need to continue to build the vision of bringing a curated experience and unique taste to consumers in China. Offering the prestige of international travel experience is also a differentiator that’s hard to copy.

Coursera is growing in China. In fact, it’s the number 2 market for the company behind the U.S. The reason Coursera is so appealing to Chinese consumers is because it offers people the opportunity to take courses created by Ivy League institutions, something both highly valuable and worth striving for. (Disclosure: GSV owns stock in Coursera)

Both companies still have a lot of work to before they can celebrate. Airbnb is facing multiple stiff local competitors and Coursera has only reach 1 million (of the nearly 700 million) Chinese Internet users.

But an ASPIRATIONAL BRAND like Airbnb or Coursera can succeed where a more utility service like Uber failed.

Easier said then done. Jia you!

Jia you literally translates into “add oil”, the most common refrain of encouragement in Chinese.

Market Update

Week ending July 9, 2017

World Indices


U.S. Indices Snapshot

Valuation P/E Est. P/E/G Price/Sales
LTM NTM Growth LTM NTM LTM NTM

Saving...