Market Snapshot
| Indices | Week | YTD |
|---|
Compound interest is the eighth wonder of the world. He who understands it, earns it … he who doesn’t … pays it.
— Albert Einstein
Last week at a Forbes fête celebrating the magazine’s centennial, Warren Buffett predicted that the Dow Jones Industrial Average would be over one million in 100 years, up from the near record 22,400 today.
Crazy? No. In fact, by Buffet’s standards, it sounds Bearish.
The roughly 3.9% compound annual growth rate needed to get from where the Dow is today to where Buffett predicts it will be in 2117 is actually lower than the 5.5% CAGR from the beginning of the 20th century when the index was founded.
To understand the magic of compound interest, consider the story of Dutchman Peter Minuit. He purchased the entire island of Manhattan for $24 worth of trinkets from the native Wappinger people in 1626. In other words, for less than the cost of a Soul Cycle class, Mr. Minuit acquired the entire Big Apple.
While there are many outside of Gotham who would look at neither as a bargain, the point is to demonstrate the power of compound interest. So, did he get a a good deal?

Obviously, the key variable to determine the answer is the interest rate that we would apply to the $24. What would the earnings have been on an alternative investment?
The difference between a 5% return and a 10% return isn’t a simple doubling but a compounding that becomes staggering over time. If the $24 had been invested at 5% interest over the past 390 years, it would have grown to $4.4 billion today, implying a good price given that Rockefeller Center alone sold for $1.9 billion in 2000.
At a 10% return, a $24 investment would be magnified 83 million times to an incomprehensible $333 quadrillion.

GSV’s fundamental investment philosophy is that growth drives enterprise value. As we’ve demonstrated, over time, share prices are nearly 100% correlated with earnings. Hence, our objective is to build a portfolio that has the highest and most sustainable growth rate.
IF YOU CAN’T MEASURE IT…
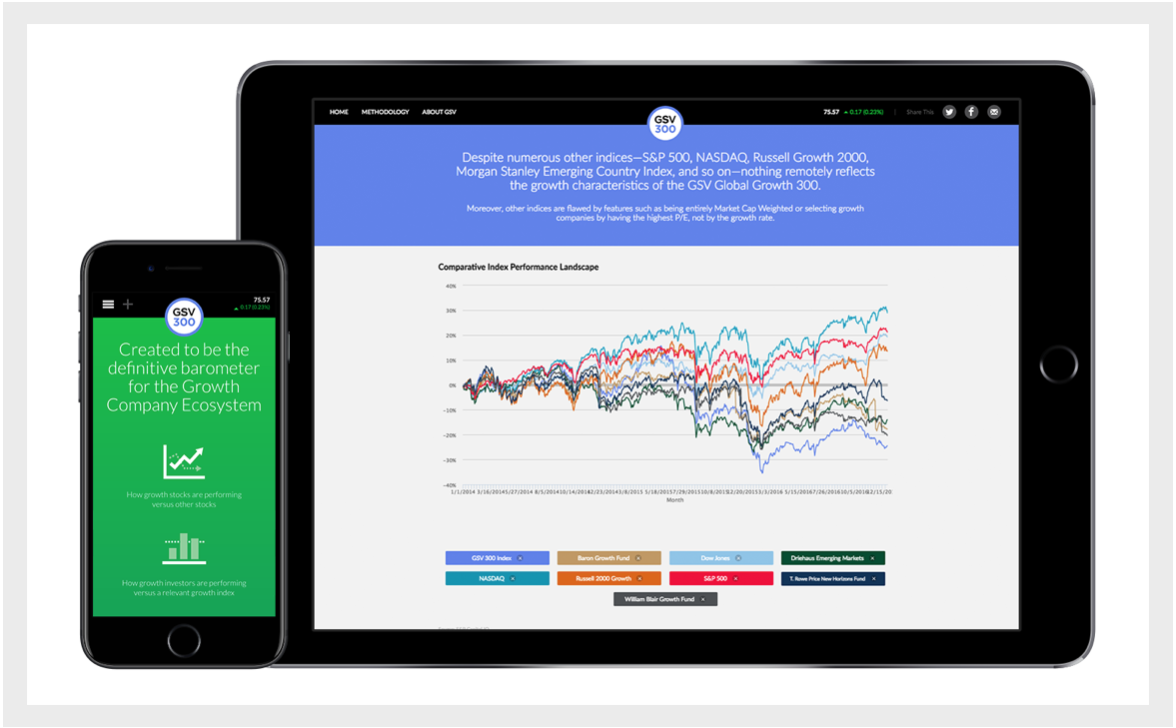
In 2015, GSV launched the GSV 300 Index, which we believe is the best representation of what is truly going on with growth companies, their valuations, and performance.
It is an index of 300 of the World’s fastest growing companies, selected systematically based on key fundamentals, including revenue and earnings growth, geography, valuation metrics, and market capitalization. Because the companies are not handpicked, the GSV 300 doesn’t look at all like the typical indexes that people use to analyze growth companies and growth investors.

The most relevant index for Institutional Investors to date has been the S&P 500, which is a good proxy for broad Market dynamics. But with a 7% long term growth rate, it hardly reflects conditions or performance for fast growing companies.
The fact that the S&P 500 is solely a market cap weighted index is problematic in that a $100 Billion Market Cap Company has 100x the impact on the Index as a $1 Billion Market Cap Company… not realistic in that a portfolio manager who viewed two portfolio companies as being equally attractive would have 100x more of that company in their portfolio.
The most well-known index, the Dow Jones Industrial Average (DJIA), is created with an even more bizarre rationale in that it is weighted by share price. So in other words, if one stock was $30 per share and another was $300 per share, the $300 stock would have 10x the influence on the DJIA as the $30 stock.
Source: GSV Asset Management
The GSV 300, by contrast, is constructed using a systematic three-step process, which is summarized below: Screening, Ranking + Scoring, and Index Weightage. For a full description of the GSV 300 construction methodology, please click HERE.

The average market capitalization of GSV 300 constituent companies is $8.2 billion, with a median of $1.7 billion. The 10 largest companies account for 25% of the index. By comparison, the top five companies in the 2,500-company NASDAQ Composite — Apple, Microsoft, Amazon, Facebook, and Alphabet (Google) — account for over 30% of the index alone.

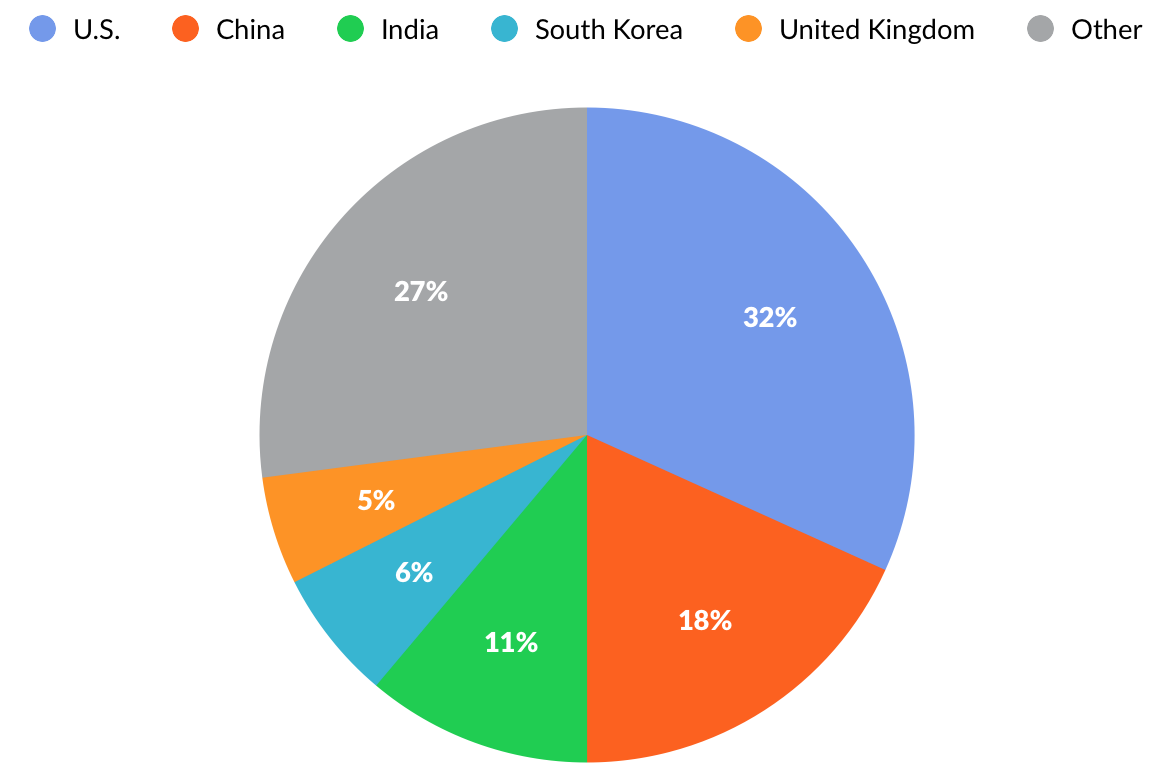
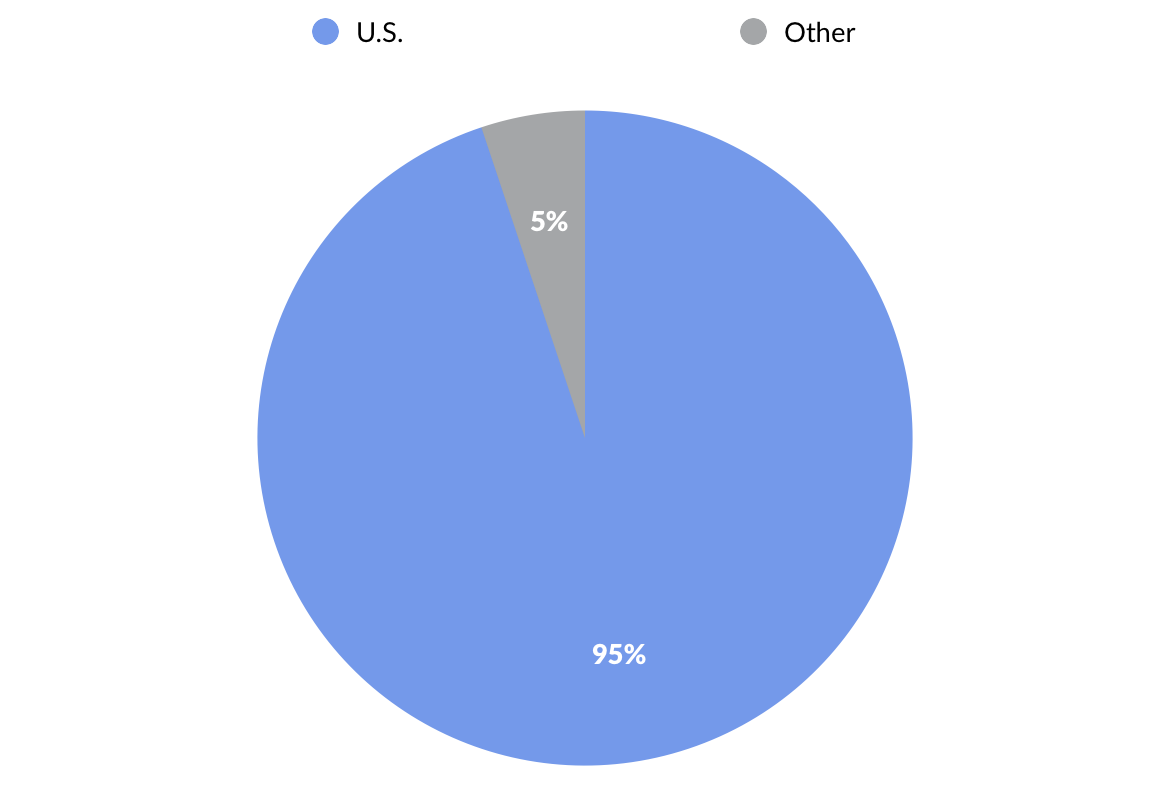
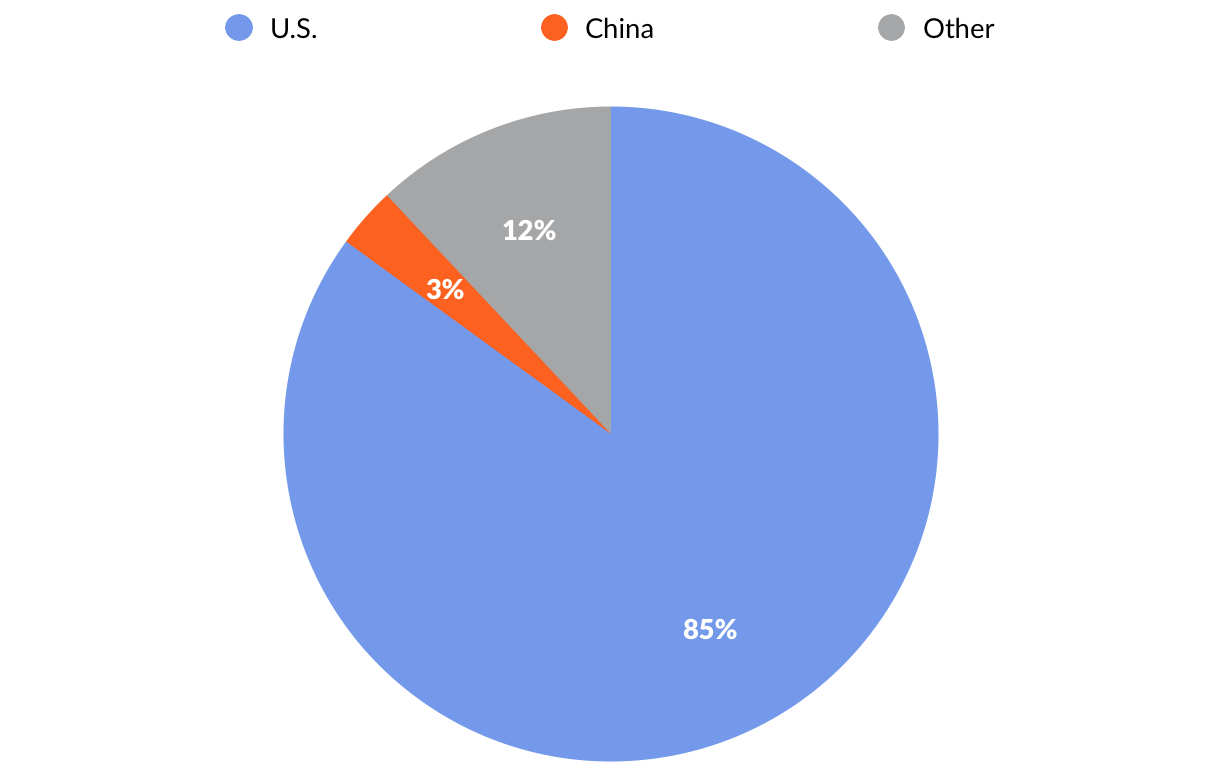
Looking at the GSV 300 by geography, 32% of the index weightage comes from U.S. companies. China is the second-largest geography at 18%, followed by India at 11%, and South Korea at 6% and the United Kingdom at 5%. By contrast, 95% of the S&P 500 and 85% of NASDAQ are represented by U.S. companies.
GSV 300 UPDATE: Q3 2017
The GSV 300 has soared 42% year-to-date, gaining 14% in the third quarter. While we were pleased with the strong performance, our objective in launching the index was to create a scorecard that reflects what is actually going on in the World of growth stocks. The real insight is in the metrics.
Segmented by country, second quarter growth was led by Chinese companies, which gained 17%. Indian and U.S. companies rose 5% and 10%, respectively.

Segmented by GSV investment theme, “Social/Mobile” enterprises recorded the highest gains, rising 13% for the quarter. “Cloud + Big Data” companies were up 10%, “Sustainability” companies were up 9%, and “Marketplace” companies were up 7%. “Education Technology” companies, by contrast, were down 16%.

We will continue to root for strong performance. But our goal with each passing quarter is to develop a data set that becomes a barometer for growth, especially when comparing the fundamentals of the GSV 300 to traditional indices.
The T. Rowe Price New Horizons Fund, for example, has pursued a strategy of investing in small, high-growth companies since 1961. While it is actively managed, Peter Lynch observed in Beating the Street that the fund is, “as close as you’ll get to a barometer of what is happening to emerging growth stocks.”
Since small companies are expected to grow at a faster rate than large companies, they usually sell at a higher P/E than larger companies. Logic might suggest, therefore, that the P/E of the New Horizons Fund would be higher than that of the S&P 500 at all times.
This isn’t always the case, and at times when it isn’t, the New Horizons Fund can be a smoke signal for an undervalued or overheated growth economy. Over the last 50 years, for example, the New Horizons P/E has risen to double that of the S&P 500 only four times.

Currently, the GSV 300 has a P/E (forward) of 27.5, or 1.4x greater than the S&P 500. Our thesis is that at over 2x, it’s a warning signal for growth stocks, and at under 1.2x, it’s a buying opportunity. We will continue to monitor this trend, as well as the relationships of other key valuation metrics, to determine patterns over time.
IPO UPDATE: Q3 2017
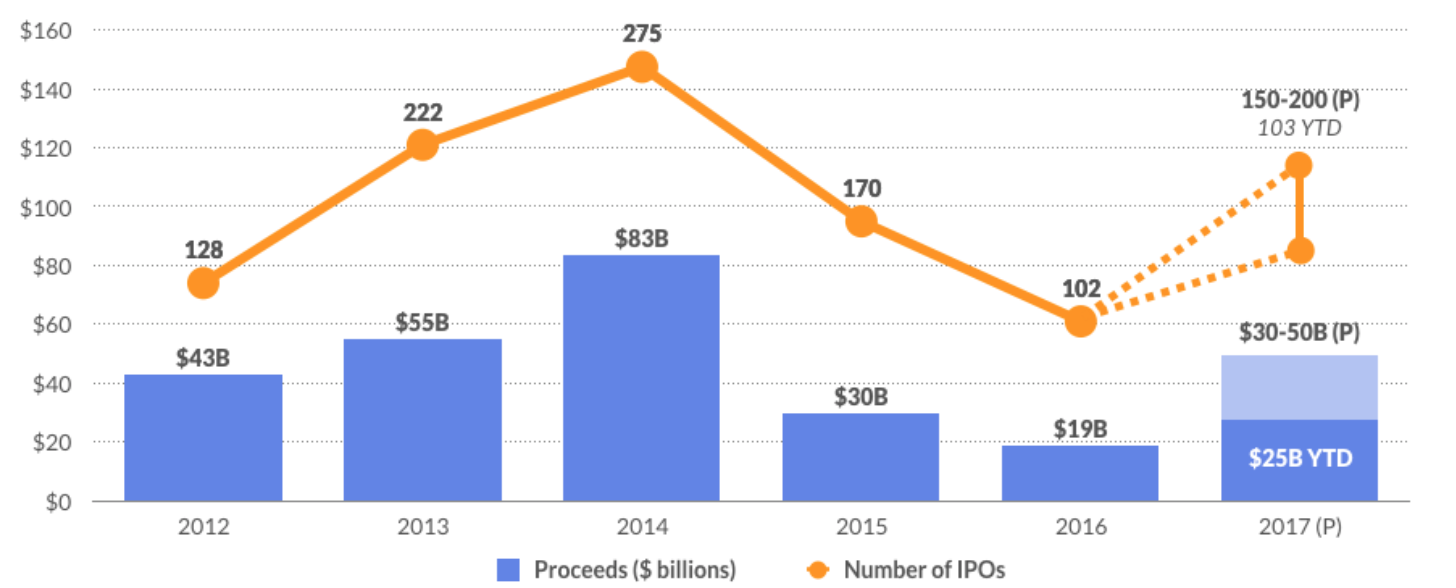
Through the end of Q3, there were 103 IPOs — 41 VC-backed — generating an average of $209 million in proceeds. This compares to 102 total IPOs (40 VC-backed) in 2016. To date, 14% of companies priced above range and 67% priced in range. The average one-day pop was 13%.

Finnish game developer, Rovio — the company behind the Angry Birds franchise — made its debut on Friday and traded flat. Rovio has launched over 15 games under the Angry Birds brand, which now includes a line of toys, theme parks, and animated feature films. Founded in 2003, the company raised $76 million from a syndicate that included Accel, Atomico, and Felicia Ventures.
Also going public this week was Roku, which creates media streaming devices and software. It popped 68% after its debut, finishing with a market cap of $2.2 billion. Roku surpassed 15 million users in the first half of 2017 who streamed over 7 billion hours of content. Founded in 2002 by CEO Anthony Wood, Roku raised $208 million in venture funding from investors including Fidelity, Hearst Ventures, Menlo Ventures, Netflix, News Corp, and Viacom.
RYB Education, a Chinese early childhood education provider, went public on Wednesday, trading up 54%. RYB is focused on a segment of the Chinese education industry that is expected to surpass $30 billion this year.
Alibaba and Foxconn-backed logistics company Best Logistics Technologies also listed last week, finishing up 20%. Founded in 2007 by Johnny Chou, the former co-President of Google China, Best Logistics provides a network of distribution services across China. The company previously raised over $788 million from a syndicate of investors including Cainiao Logistics, CDH Investments, CITIC, and IFC (the VC arm of the World Bank).
Also of note, in July, real estate marketplace Redfin completed a successful IPO, popping 45%. Based in Seattle and founded in 2004, Redfin previously raised $186 million from investors including T. Rowe Price, Madrona, DFJ, and Wellington. Redfin was last valued at $500 million in 2015.
