Market Snapshot
| Indices | Week | YTD |
|---|
When it comes to tracking the state of play in the global growth economy, an old saying rings true: “If you can’t measure it, you can’t manage it.”
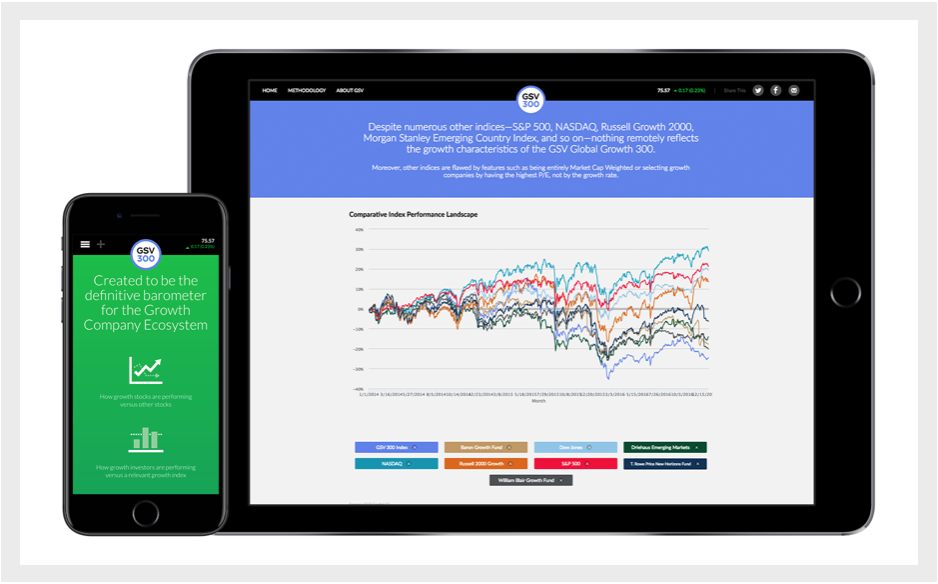
So in 2015, GSV launched the GSV 300 Index, which we believe is the best representation of what is truly going on with growth companies, their valuations, and performance. It is an index of 300 of the World’s fastest growing companies, selected systematically based on key fundamentals, including revenue and earnings growth, geography, valuation metrics, and market capitalization.
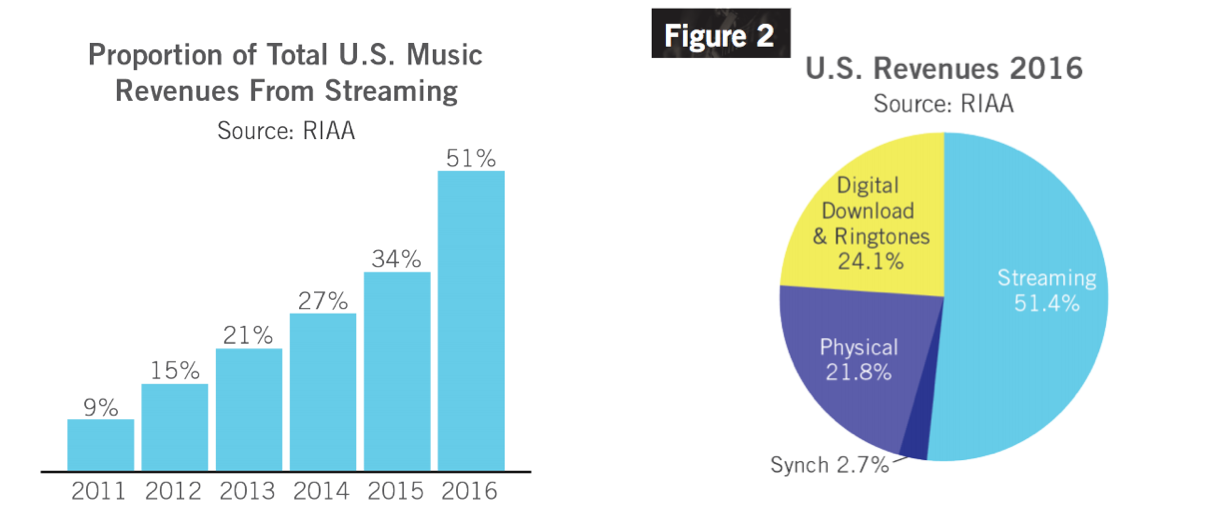
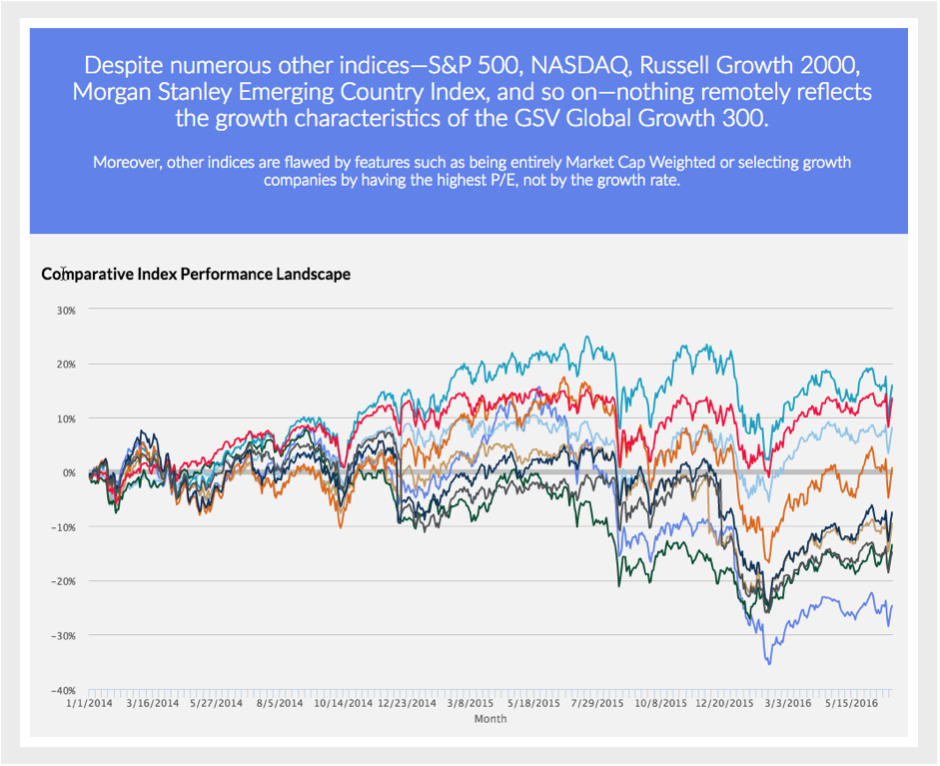
With the GSV 300 up 16% for the quarter, it’s a strong indication that technology and growth stocks are back in vogue and that we have a robust IPO market coming. Because the companies aren’t handpicked, the GSV 300 doesn’t look at all like the indexes that people typically use to analyze growth companies and growth investors.
The most relevant index for Institutional Investors to date has been the S&P 500, which is a good proxy for broad Market dynamics. But with a 5% long term growth rate, it hardly reflects conditions or performance for fast growing companies.
The fact that the S&P 500 is solely a market cap weighted index is problematic in that a $100 Billion Market Cap Company has 100x the impact on the Index as a $1 Billion Market Cap Company… not realistic in that a portfolio manager who viewed two portfolio companies as being equally attractive would have 100x more of that company in their portfolio.
The most well-known index, the Dow Jones Industrial Average (DJIA), is created with an even more bizarre rationale in that it is weighted by share price. So in other words, if one stock was $30 per share and another was $300 per share, the $300 stock would have 10x the influence on the DJIA as the $30 stock.
The GSV 300, by contrast, is constructed using a systematic three-step process, which is summarized below: Screening, Ranking + Scoring, and Index Weightage. For a full description of the GSV 300 construction methodology, please click HERE.

GSV 300 UPDATE: Q1 2017
The “Trump Bump” was in full effect in Q1 2017, with indices rallying the World over. For the quarter, the Dow was up 4.6%, the S&P 500 gained 5.5%, and NASDAQ rose 9.8%. The GSV 300 roared up 16.6%.

While we were pleased to see the GSV 300 ring in a strong quarter, our objective in launching the index was to create a scorecard that reflects what is actually going on in the World of growth stocks. The real insight is in the metrics.
GSV 300 Snapshot
The average market capitalization of GSV 300 constituent companies is $5.5 billion, with a median of $1.4 billion. The 10 largest companies account for 25% of the index. By comparison, the top five companies in the 2,500-company NASDAQ Composite — Apple, Microsoft, Amazon, Facebook, and Alphabet (Google) — account for over 30% of the index alone.

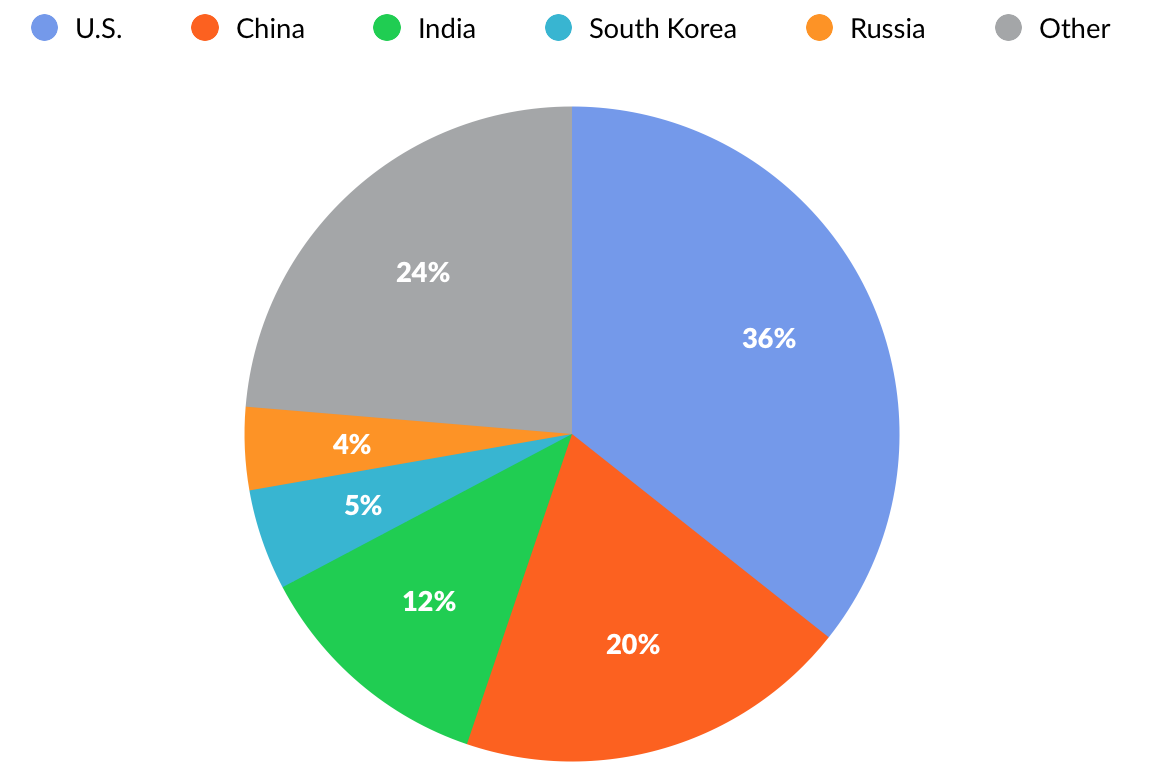
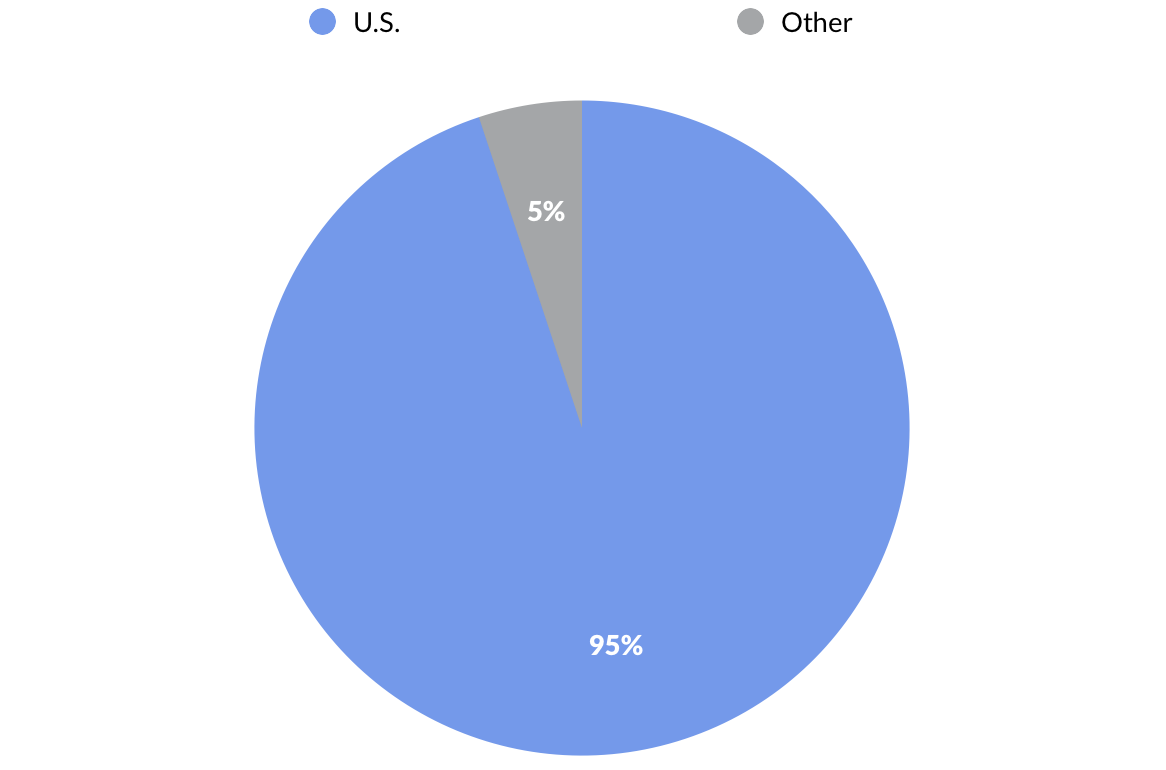
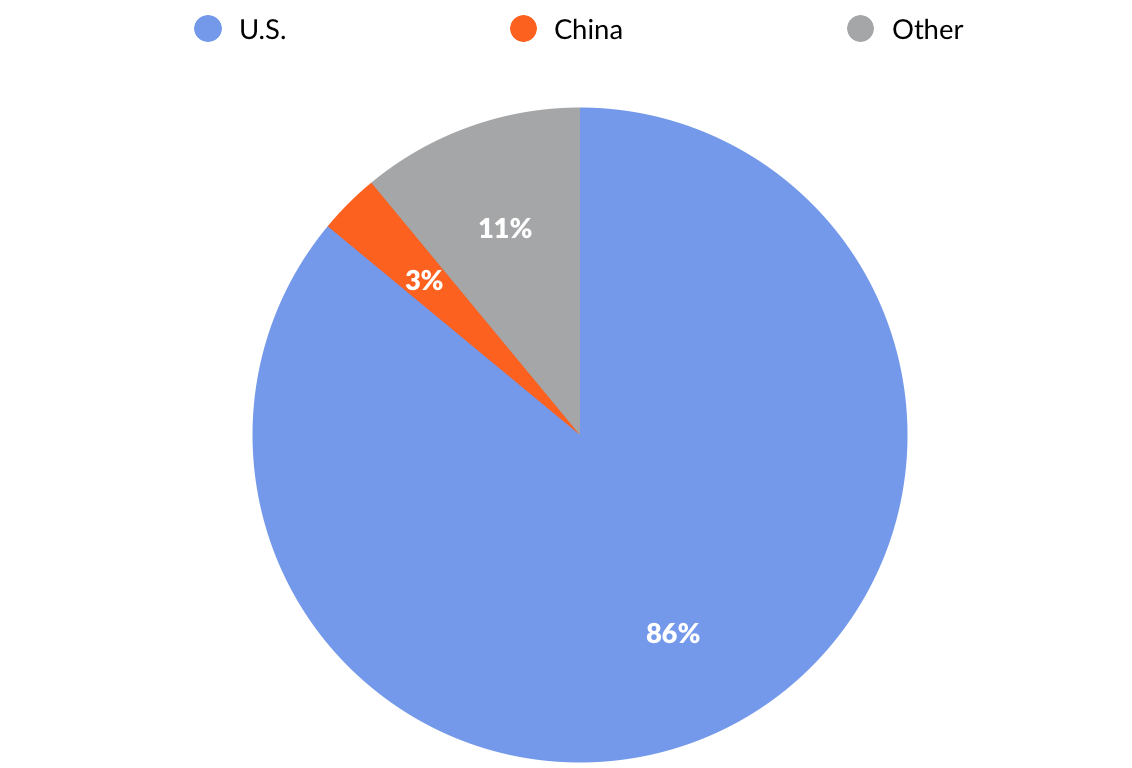
Looking at the GSV 300 by geography, 36% of the index weightage comes from U.S. companies. China is the second-largest geography at 20%, followed by India at 12%, and South Korea at 5%. By contrast, 95% of the S&P 500 and 86% of NASDAQ are represented by U.S. companies.
Performance & Valuation
The GSV 300 surged 16.6% in the first quarter, with strong performances from companies in the United States (+17%), China (+15%), and India (+27%), which together comprise over 67% of the index.

Segmented by GSV investment theme, “Education Technology” enterprises recorded the highest gains, rising 27% for the quarter. “Social/Mobile” companies were up 17% while “Cloud + Big Data” and “Sustainability” companies were up 16% apiece.

We will continue to root for strong performance. But our goal with each passing quarter is to develop a data set that becomes a barometer for growth, especially when comparing the fundamentals of the GSV 300 to traditional indices.
The T. Rowe Price New Horizons Fund, for example, has pursued a strategy of investing in small, high-growth companies since 1961. While it is actively managed, Peter Lynch observed in Beating the Street that the fund is, “as close as you’ll get to a barometer of what is happening to emerging growth stocks.”
Since small companies are expected to grow at a faster rate than large companies, they usually sell at a higher P/E than larger companies. Logic might suggest, therefore, that the P/E of the New Horizons Fund would be higher than that of the S&P 500 at all times.
This isn’t always the case, and at times when it isn’t, the New Horizons Fund can be a smoke signal for an undervalued or overheated growth economy. Over the last 50 years, for example, the New Horizons P/E has risen to double that of the S&P 500 only four times.

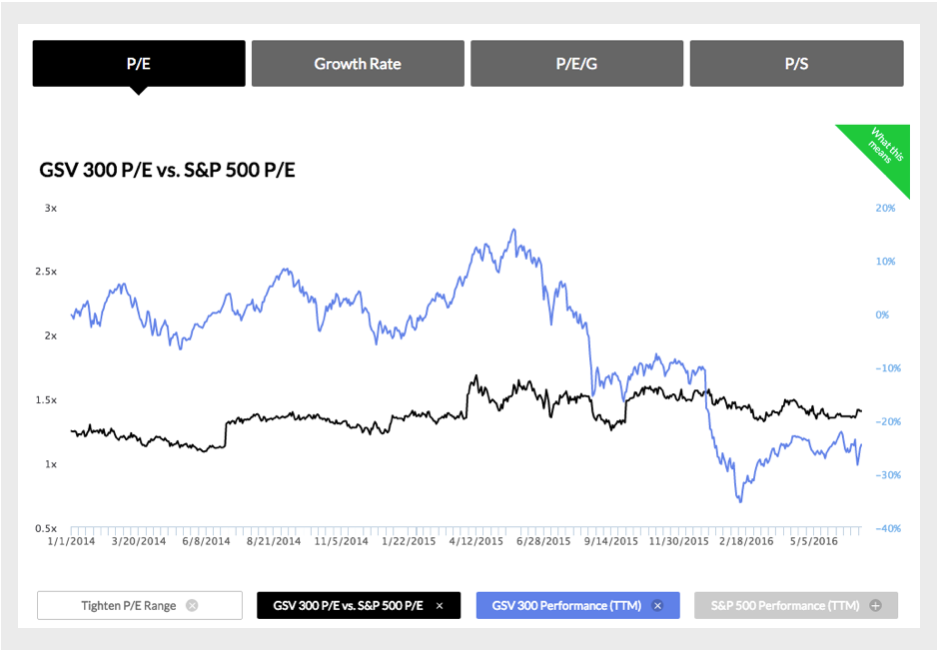
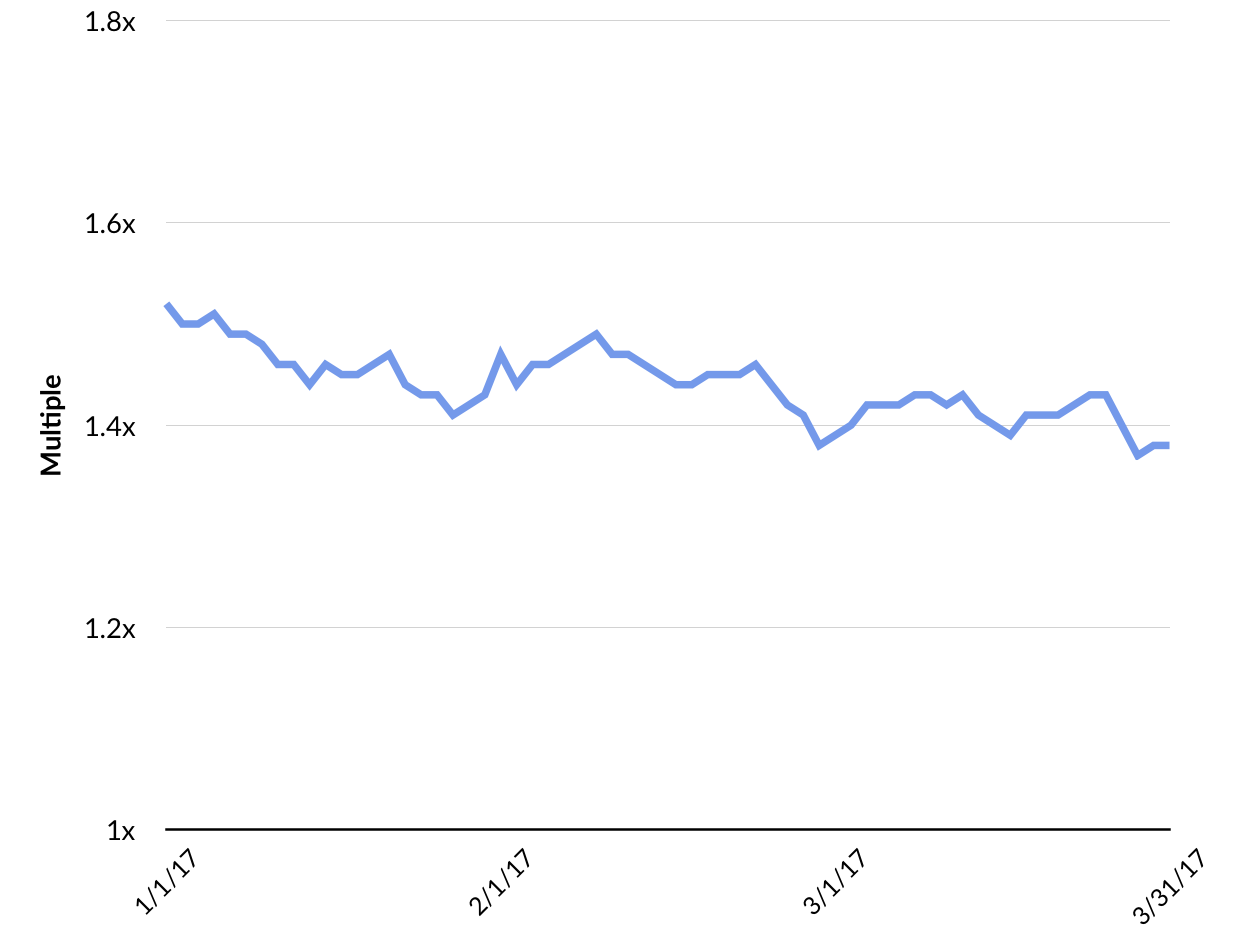
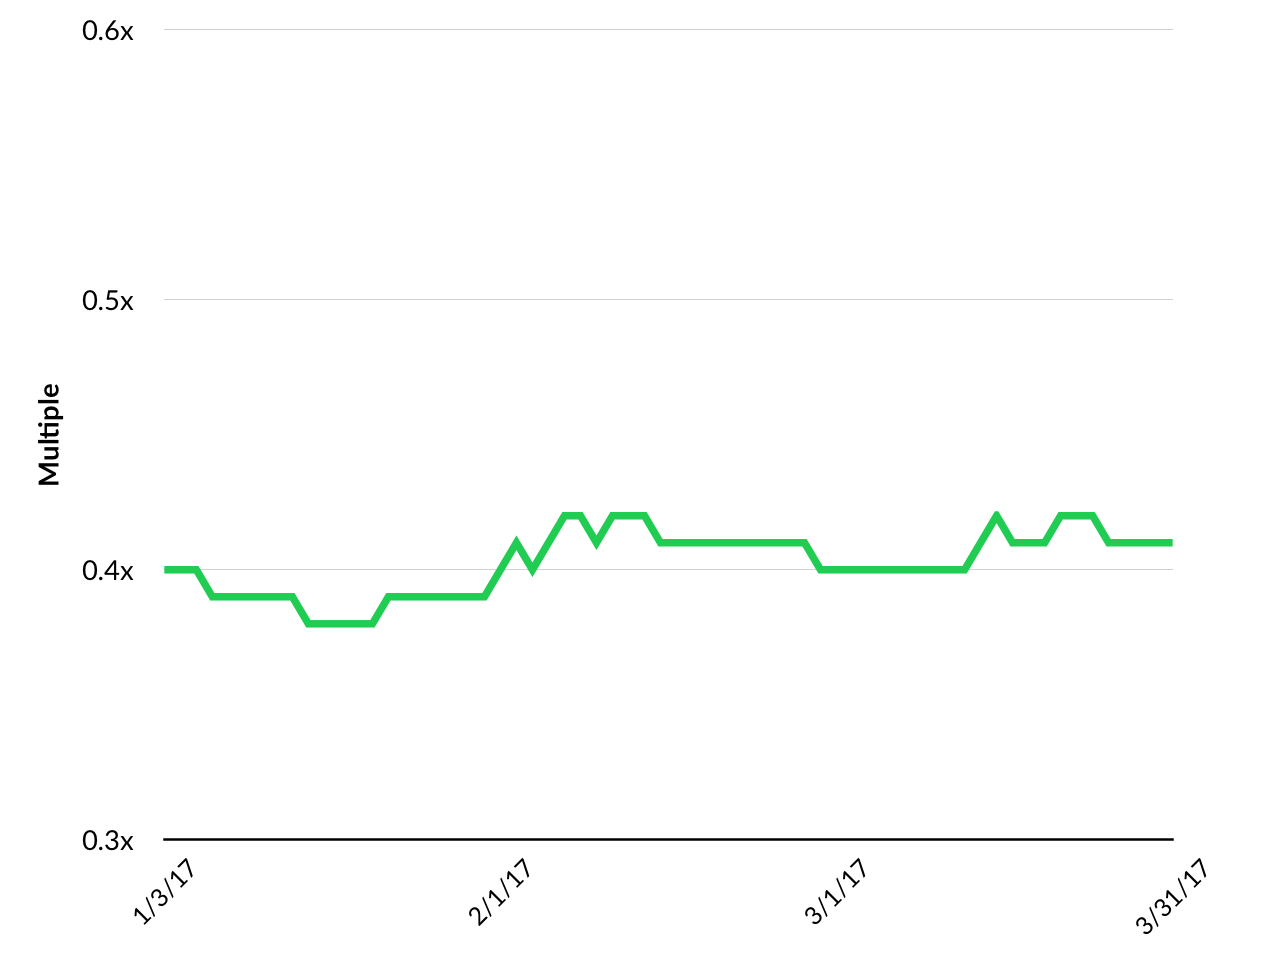
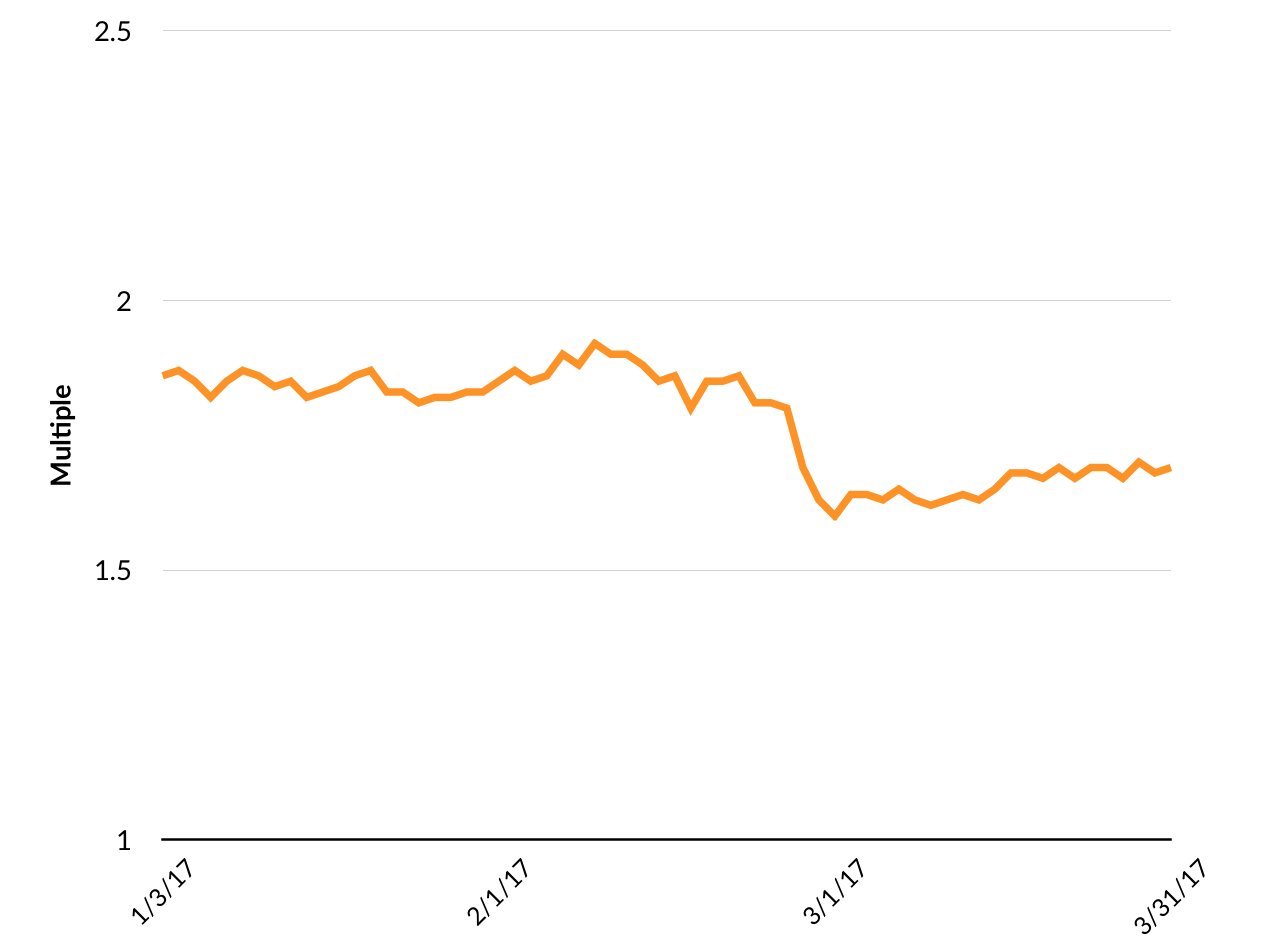
Currently, the GSV 300 has a P/E (forward) of 25.1, or 1.4x greater than the S&P 500. Our thesis is that at over 2x, it’s a warning signal for growth stocks, and at under 1.2x, it’s a buying opportunity. We will continue to monitor this trend, as well as the relationships of other key valuation metrics, to determine patterns over time.
IPO UPDATE: Q1 2017
There were 23 IPOs in Q1 017, compared to eight at the same time last year. The $9.9 billion of total proceeds marked a seven-quarter high, as GSV Capital portfolio company Snap (parent of Snapchat) raised $3.4 billion. It was the largest IPO of a U.S. company since Facebook, which raised $16 billion in 2012, and the largest overall since Alibaba, which raised $21.8 billion in 2014. (Disclosure: GSV owns shares in Snap)

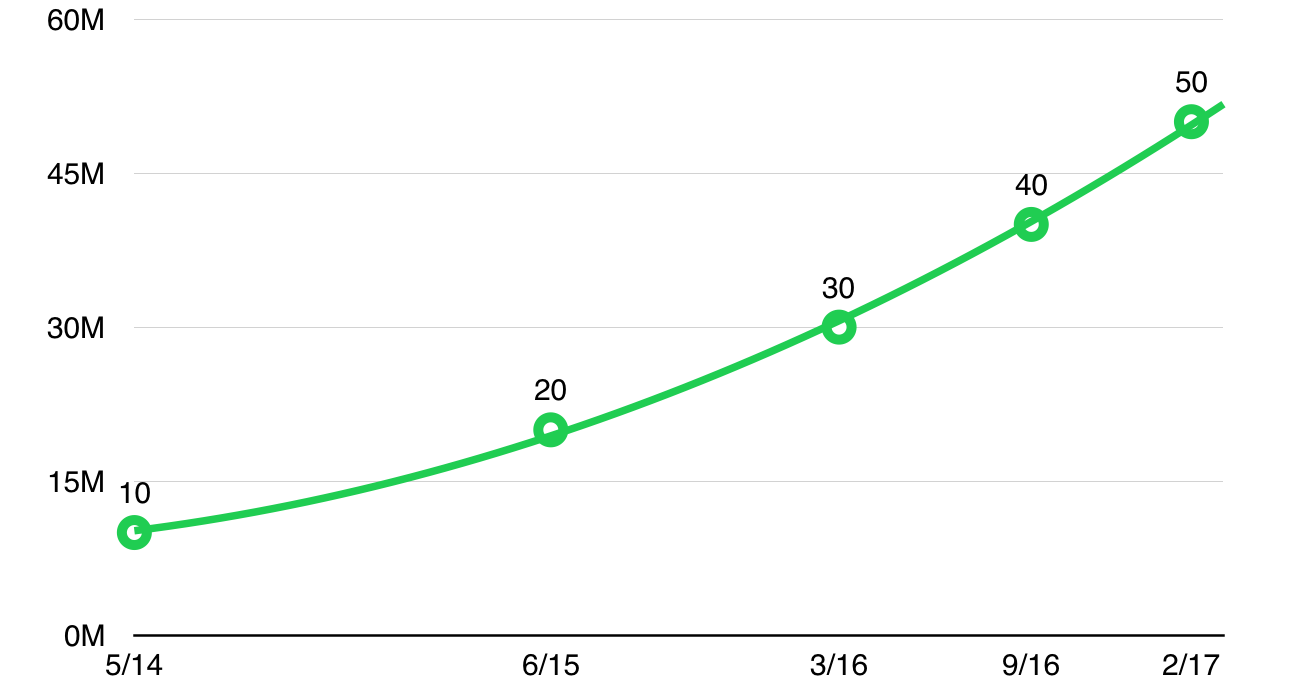
We were pleased to see Snap’s strong IPO. Reportedly 10-times oversubscribed, it was greeted by eager investors, pricing above the range and popping 44%. Today, the company has well over 150 million daily users uploading an average of 29,000 Snaps per second and watching a mind-blowing 10+ billion videos per day, up from just two billion in May 2015. Users spend nearly 30 minutes on the app per day and over 60% share new content every day.
Interestingly, while Snap’s growth surged by almost every relevant metric in the lead up to its IPO, its valuation was no stranger to volatility. In the fall of 2015, for example, Fidelity Investments marked down its position in the company by 25%, only to mark it up again 15% in December of the same year. In March of 2016, Fidelity invested $175 million in Snapchat at a flat valuation to its previous financing. The consistent thread over this period is that Snap continued to rapidly emerge as a transformational force in media.
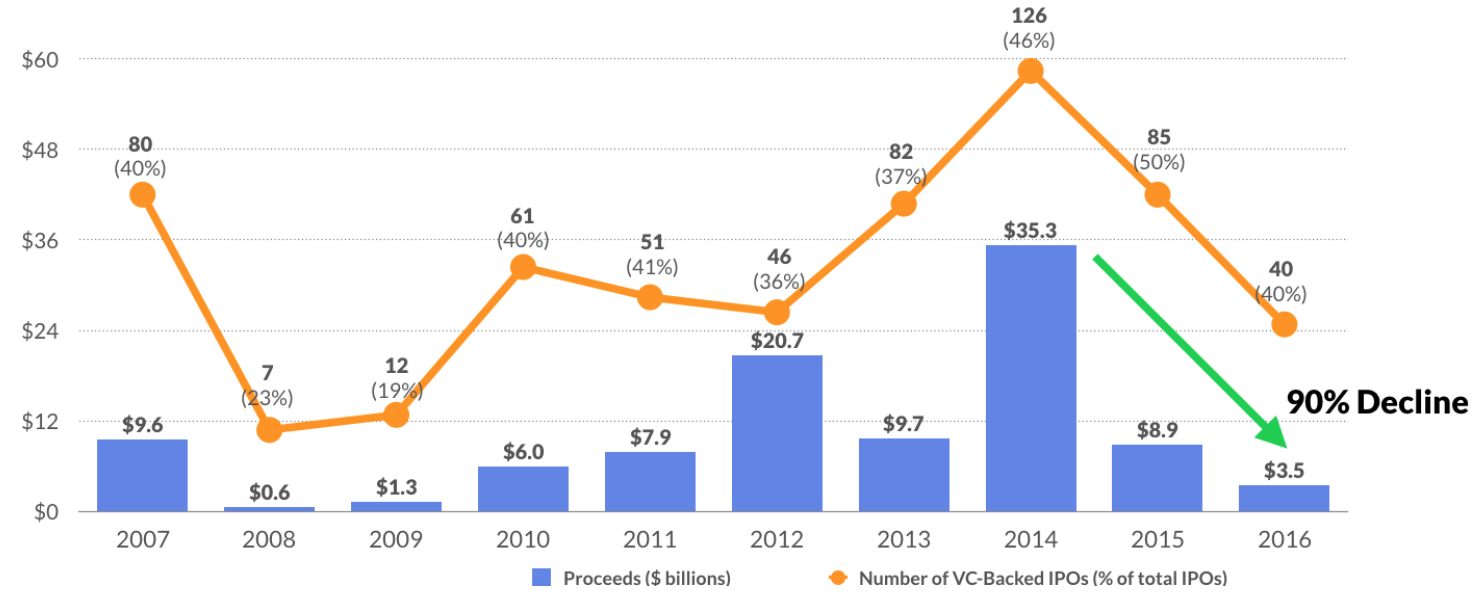
While we were pleased to see a portfolio company go public, Snap’s listing signals a broader opportunity for the best names to break through an IPO backlog that has been building for the last fifteen years. Just 102 U.S. companies went public in 2016 — only 40 were venture-backed. IPO proceeds from venture-backed companies are down 90% from 2014 to 2016.
Before Snap, AppDynamics, an enterprise software company that helps companies monitor application performance, was poised to be the first major IPO of the year. But it was snatched up by Cisco the night before it listed in a $3.7 billion acquisition, nearly twice the value it had priced its IPO.
Two weeks after Snap’s IPO, MuleSoft went public and popped 45%. Founded in 2006, MuleSoft helps businesses use APIs to integrate a variety of software and services. It counts corporations such as Coca Cola, McDonalds, Salesforce and Unilever as clients. MuleSoft raised $259 million from a syndicate of leading investors including NEA and Lightspeed Venture Partners at a $1.5 billion valuation before its IPO.
Last week, data analytics company Alteryx went public, popping 11%. Founded in 2010 Alteryx counts Amazon and Ford among its customers and the company had previously raised $163 million from investors including Insight Venture Partners, ICONIQ, and Meritech Capital Partners.

Disclosure: GSV owns shares in Lyft
IPOs on deck include Okta and Yext, which filed to go public within one day of each other. Okta, a cybersecurity platform, is currently valued at $1.2 billion and has raised $229 million from investors including Andreessen Horowitz, Greylock, Sequoia and Khosla Ventures. Yext, which powers the location results that appear on search engines, has raised over $117 million at reported $500+ million valuation.